Please note that the page stats are based on the recorded sessions only.
To view the report, go to the Analytics > Attendance section.
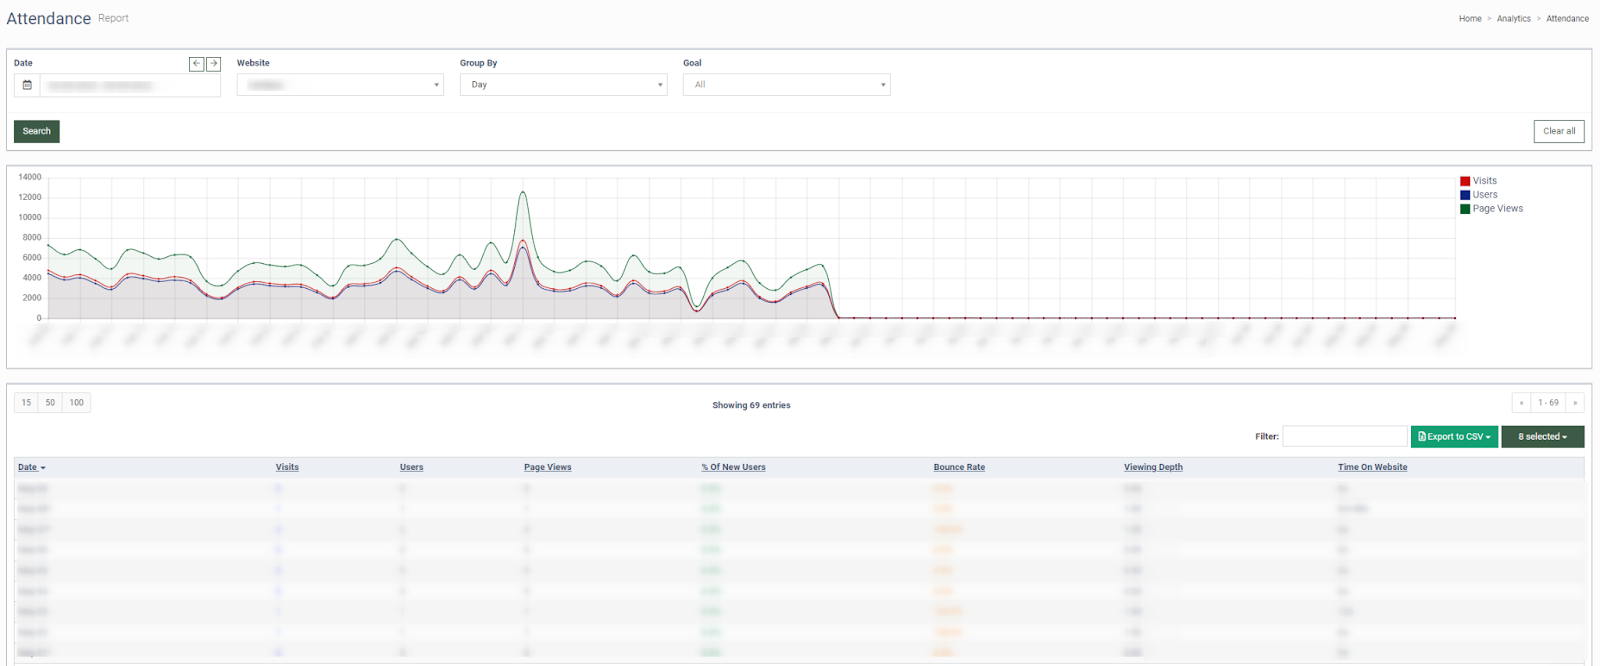
The “Attendance” report contains the following information:
-
Date: The date range to filter the statistics.
-
Visits: The number of visits.
-
Users: The number of users.
-
Page Views: The number of page views.
-
% Of New Users: The percentage of new users who visited the website on this date.
-
Bounce Rate: The percentage of users who opted out of browsing the website (the user gets to the website but does not make clicks and closes the web page in less than 15 seconds).
-
Viewing Depth: An average website browsing depth measured in pages. The depth is calculated by the number of pages viewed divided by the number of users.
-
Time On Website: Time users spend on the website.
The chart at the top of the page shows the number of visits, users, and page views over a specific date range.
You can narrow down the search results by using the following filters:
-
Date: Select the date range.
-
Website: Select the website.
-
Group By: Select the grouping method (Day, Week, Month).
-
Goal: Select the goal.
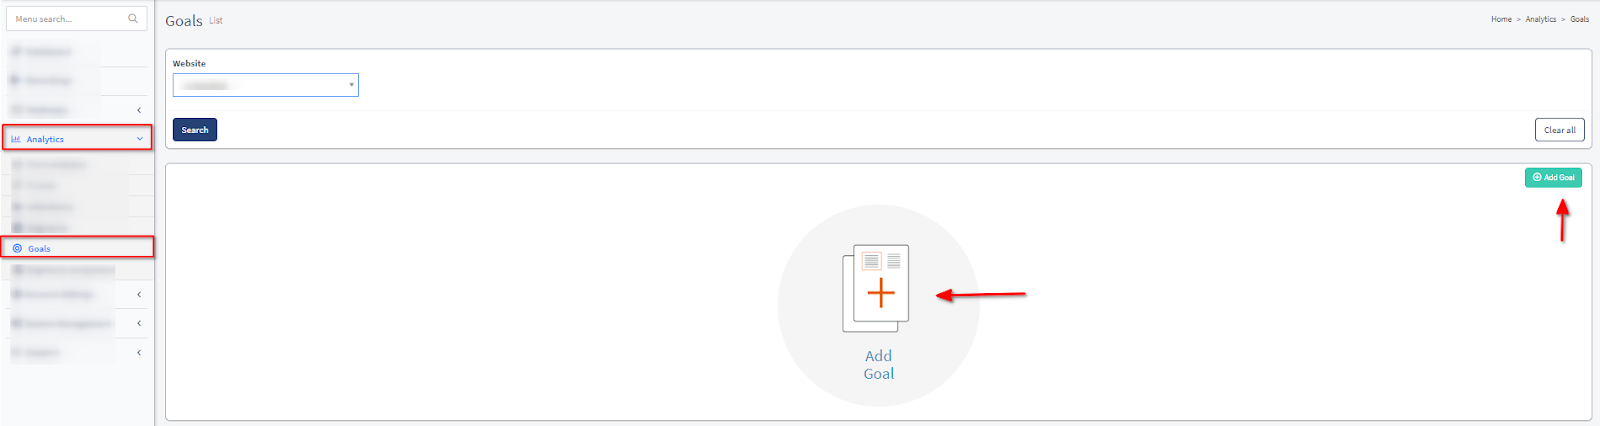
Note: To set up a goal, go to Analytics > Goals, select a website from the list, and click on the Add Goal button at the center or the green button in the upper right corner of the segment.