Whether you're short on time or seeking a high-level overview, the Comparison Report will help you analyze your business development by comparing performance data from different periods for both Buyers and Publishers.
To view the report, go to the Analytics and Optimization > Performance Tools > Comparison Report section.
Here, you can quickly access both Buyer's and Publisher's analytics, including key metrics like presented count, lead count, sold count, send error count, timeout, overall revenue, and more. What sets this tool apart is its capacity to compare these metrics across four periods for in-depth insights into your performance trends. By employing various filters, you can refine the report data and categorize information according to your specific needs and scope.
You can generate data by Buyer, Buyer by State, Publisher, Publisher by State, Publisher by Channel, Publisher by Phone Number, Publisher by Source, Buyer by Publisher, Buyer by Hour, and Publisher by Hour for comparison.
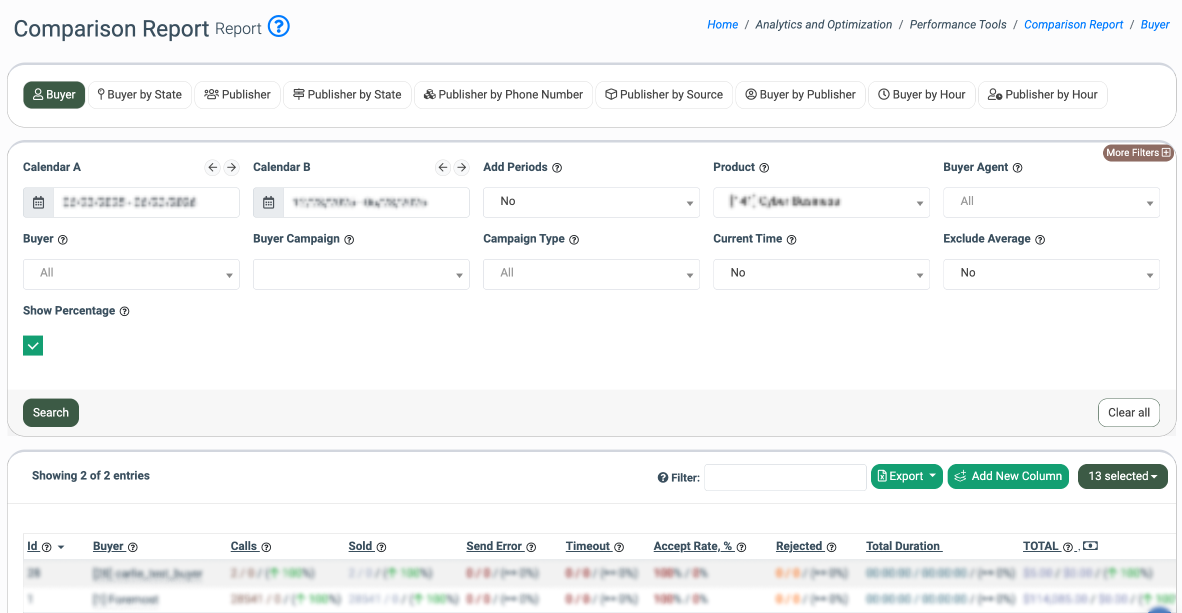
Buyer
The “Buyer” tab allows you to view and compare the performance of each individual buyer across four different time periods. The comparison will display the performance data, including both the numerical figures and the corresponding percentage changes.
In the generated report, you can see the performance data for each Buyer in the following columns:
- Id: The unique identification number of the Buyer.
- Buyer: The name and ID of the Buyer.
- Pings: The comparison of the number of pings for the chosen time periods.
- Pings Accepted: The comparison of the number of accepted pings for the chosen time periods.
- Presented: The comparison of the number of leads (posts) for the chosen time periods.
- Sold: The comparison of the number of the sold leads (accepts) for the chosen time periods.
- Send Error: The comparison of the number of posting errors for the chosen time periods.
- Timeout: The comparison of the number of leads with timeout status for the chosen time periods.
- Redirects, %: The comparison of the percentage of redirects for the chosen time periods.
- Accept Rate, %: The comparison ratio of sold leads(accepts) to the total leads (posts) for the chosen time periods.
- Rejected: The comparison ratio of the rejected leads (posts) amount for the chosen time periods.
- Total Duration: The total duration of the call.
- TOTAL: The comparison of the total revenue for the chosen time periods.
- ADM: The comparison of the Admin revenue for the chosen time periods.
- CPL: The comparison of the Cost per Lead rates for the chosen time periods.
- ALP: The comparison of the Average per Lead (the ratio of total revenue to the number of sold leads (accepts)) rates for the chosen time periods.
You can narrow down the search results by using the following filters:
- Calendar A: Select the date range for the comparison for Calendar A.
- Calendar B: Select the date range for the comparison for Calendar B.
- Add Periods: Select the “Yes” option to add two additional calendars (the “Calendar C” and the “Calendar D” filter fields).
- Product: Select the Product.
- Buyer Agent: Select the Buyer Agent.
- Buyer: Select the Buyer.
- Buyer Campaign: Select the Campaign of the particular Buyer.
- Buyer Tags: Select the Buyer Tag.
- Campaign Type: Select the Campaign type (ExitOffer / Redirect / Silent / Smart Tree).
- Campaign Tags: Select the Campaign Tag.
- Current Time: Select the “Yes” option to summarize the data up to the current time for each selected date within the data range.
- Exclude Average: Select the “Yes” option to summarize all data and divide it by the number of days for the selected date range.
- Show Percentage: Check the box to display the performance difference in percentage for the selected date range for each of the selected data columns in the report.
Click the “Search” button to generate the report.
To create a custom column, click the “Add New Column” button. Note: The custom column creation is available only under the Global Admin and Support system roles. Read more about the Custom Columns in Reports in the Knowledge Base article.
Buyer by State
The “Buyer by State” tab allows you to view and compare the report of the Buyers’ performance across four different time periods for each state (only for the US). The comparison will display the performance data, including both the numerical figures and the corresponding percentage changes.
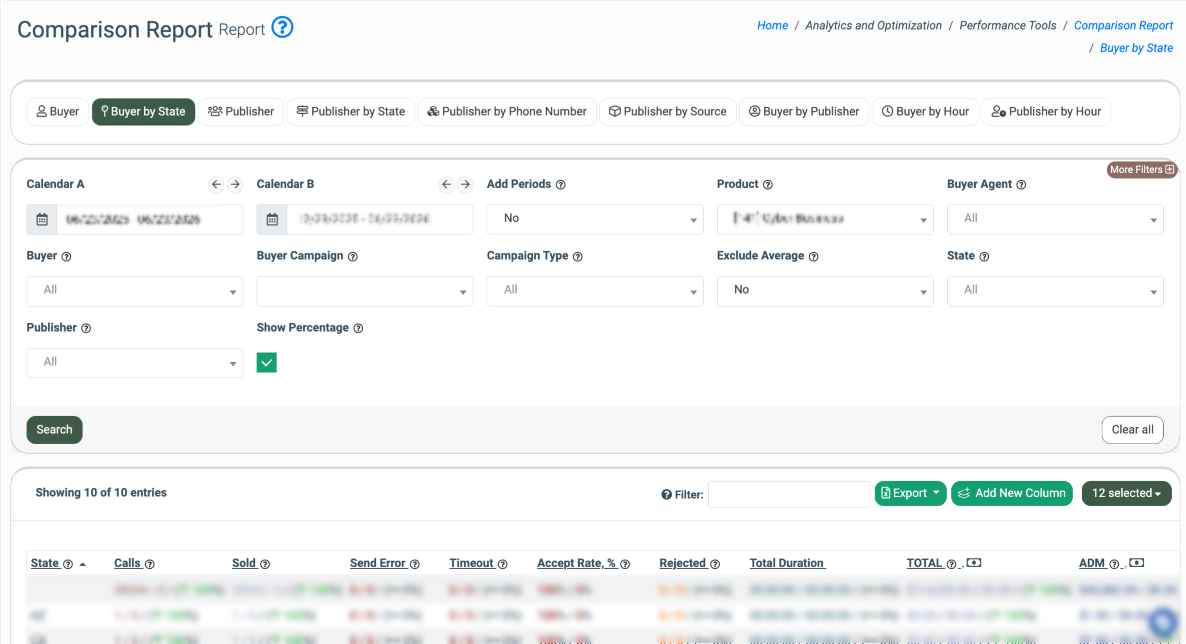
In the generated list, you can see the Buyers’ performance data for each state in the following columns:
- State: The name of the State.
- Pings: The comparison of the number of pings for the chosen time periods.
- Pings Accepted: The comparison of the number of accepted pings for the chosen time periods.
- Presented: The comparison of the leads (posts) for the chosen time periods.
- Sold: The comparison of the sold leads (accepts) for the chosen time periods.
- Send Error: The comparison of the number of posting errors for the chosen time periods.
- Timeout: The comparison of the number of leads with timeout status for the chosen time periods.
- Redirects, %: The comparison of redirects number percentage for the chosen time periods.
- Accept Rate, %: The comparison of the percentage ratio of sold leads (accepts) to total leads (posts) amount for the chosen time periods.
- Rejected: The comparison of the rejected leads amount for the selected date range.
- Total Duration: The total duration of the call.
- TOTAL: The comparison of the total revenue for the chosen time periods.
- ADM: The comparison of the Admin revenue for the chosen time periods.
- CPL: The comparison of the Cost per Lead rates for the chosen time periods.
- ALP: The comparison of the Average per Lead rates for the chosen time periods.
You can narrow down the search results by using the following filters:
- Calendar A: Select the date range for the comparison for Calendar A.
- Calendar B: Select the date range for the comparison for Calendar B.
- Add Periods: Select the “Yes” option to add two additional calendars (the “Calendar C” and the “Calendar D” filter fields).
- Product: Select the Product.
- Buyer Agent: Select the Buyer Agent.
- Buyer: Select the Buyer.
- Buyer Campaign: Select the Campaign of the particular Buyer.
- Buyer Tags: Select the Buyer Tag.
- Campaign Type: Select the Campaign type (ExitOffer / Redirect / Silent / Smart Tree).
- Campaign Tags: Select the Campaign Tag.
- Exclude Average: Select the “Yes” option to summarize all data and divide it by the number of days for the selected date range.
- State: Select the State.
- Publisher: Select the Publisher.
- Show Percentage: Check the box to display the performance difference in percentage for the selected date range for each of the selected data columns in the report.
Click the “Search” button to generate the report.
To create a custom column, click the “Add New Column” button. Note: The custom column creation is available only under the Global Admin and Support system roles. Read more about the Custom Columns in Reports in the Knowledge Base article.
Publisher
The “Publisher” tab allows you to view and compare the performance of each individual publisher across four different time periods. The comparison will display the performance data, including both the numerical figures and the corresponding percentage changes.
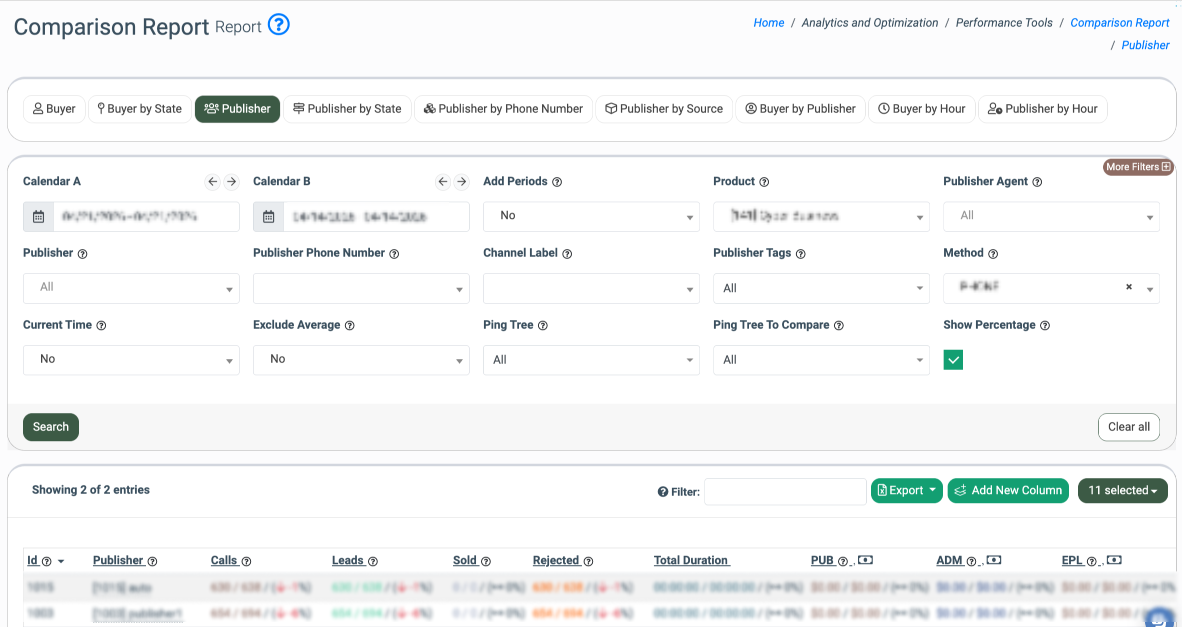
In the generated list, you can see the performance data for each Publisher in the following columns:
- Id: The unique identification number of the Publisher.
- Publisher: The name and the ID of the Publisher.
- Pings: The comparison of the number of pings for the chosen periods.
- Pings Accepted: The comparison of the number of accepted pings for the chosen periods.
- Post: The comparison of the number of posts for the chosen periods.
- Post to Compare: The comparison of the number of posts for the selected periods based on the ping trees chosen through the “Ping Tree To Compare” filter.
Note: This column is only active if a selection is made using the “Ping Tree To Compare” filter. - Post Comparison: The compared ratio between the data in the “Ping” and “Ping to Compare” fields.
Note: This column is only active if a selection is made using the “Ping Tree To Compare” filter. - Leads: The comparison of the number of leads for the chosen periods.
- Leads to Compare: The comparison of the number of leads for the selected periods based on the ping trees chosen through the “Ping Tree To Compare” filter. Note: This column is only active if a selection is made using the “Ping Tree To Compare” filter.
- Leads Comparison: The compared ratio between the data in the “Leads” and “Leads to Compare” fields.
Note: This column is only active if a selection is made using the “Ping Tree To Compare” filter.
- Sold: The comparison of the number of sold leads for the chosen periods.
- Sold to Compare: The comparison of the number of sold leads for the selected periods based on the ping trees chosen through the “Ping Tree To Compare” filter.
Note: This column is only active if a selection is made using the “Ping Tree To Compare” filter.
- Sold Comparison: The compared ratio between the data in the “Sold” and “Sold to Compare” fields.
Note: This column is only active if a selection is made using the “Ping Tree To Compare” filter.
- Redirects, %: The comparison of the number of redirects percentage for the selected periods.
- Redirects, % to Compare: The comparison of the number of redirects percentage for the selected periods based on the ping trees chosen through the “Ping Tree To Compare” filter.
Note: This column is only active if a selection is made using the “Ping Tree To Compare” filter.
- Redirects, % Comparison: The compared ratio between the data in the “Redirects, %” and “Redirects, % to Compare” fields.
Note: This column is only active if a selection is made using the “Ping Tree To Compare” filter.
- Rejected: The comparison of the number of rejected leads for the chosen periods.
- Rejected to Compare: The comparison of the number of rejected leads for the selected periods based on the ping trees chosen through the “Ping Tree To Compare” filter.
Note: This column is only active if a selection is made using the “Ping Tree To Compare” filter.
- Rejected Comparison: The compared ratio between the data in the “Rejected” and “Rejected to Compare” fields.
Note: This column is only active if a selection is made using the “Ping Tree To Compare” filter. - Total Duration: The total duration of the call.
- PUB: The comparison of the Publisher’s earnings for the chosen periods.
- PUB to Compare: The comparison of the number of Publisher’s earnings for the selected periods based on the ping trees chosen through the “Ping Tree To Compare” filter.
Note: This column is only active if a selection is made using the “Ping Tree To Compare” filter.
- PUB Comparison: The compared ratio between the data in the “PUB” and “PUB to Compare” fields.
Note: This column is only active if a selection is made using the “Ping Tree To Compare” filter.
- ADM: The comparison of the Admin revenue for the chosen periods.
- ADM to Compare: The comparison of the number of Admin revenue for the selected periods based on the ping trees chosen through the “Ping Tree To Compare” filter.
Note: This column is only active if a selection is made using the “Ping Tree To Compare” filter.
- ADM Comparison: The compared ratio between the data in the “ADM” and “ADM to Compare” fields.
Note: This column is only active if a selection is made using the “Ping Tree To Compare” filter.
- Dup 1 Day, %: The comparison of the number of duplicate leads recorded in the system within the last 24 hours for the chosen periods. Check the box “Show Lead Quality” to display this column.
- Dup 14 Days, %: The comparison of the number of duplicate leads recorded in the system within the past 14 days for the chosen periods. Check the box “Show Lead Quality” to display this column.
- Dup 30 Days, %: The comparison of the number of duplicate leads recorded in the system within the past 30 days for the chosen periods. Check the box “Show Lead Quality” to display this column.
- Dup 45 Days, %: The comparison of the number of duplicate leads recorded in the system within the past 45 days for the chosen periods. Check the box “Show Lead Quality” to display this column.
- EPL: The comparison of the Earnings per Lead rates for the chosen periods.
- EPL to Compare: The comparison of the Earnings per Lead rates for the selected periods based on the ping trees chosen through the “Ping Tree To Compare” filter.
Note: This column is only active if a selection is made using the “Ping Tree To Compare” filter.
- EPL Comparison: The compared ratio between the data in the “EPL” and “EPL to Compare” fields.
Note: This column is only active if a selection is made using the “Ping Tree To Compare” filter.
- ALP: The comparison of the Average per Lead rates for the chosen periods.
- ALP to Compare: The comparison of the Average per Lead rates for the selected periods based on the ping trees chosen through the “Ping Tree To Compare” filter.
Note: This column is only active if a selection is made using the “Ping Tree To Compare” filter.
- ALP Comparison: The compared ratio between the data in the “ALP” and “ALP to Compare” fields.
Note: This column is only active if a selection is made using the “Ping Tree To Compare” filter.
You can narrow down the search results by using the following filters:
- Calendar A: Select the date range for the comparison for Calendar A.
- Calendar B: Select the date range for the comparison for Calendar B.
- Add Periods: Select the “Yes” option to add two additional calendars (the “Calendar C” and the “Calendar D” filter fields).
- Product: Select the Product.
- Publisher Agent: Select the Publisher Agent.
- Publisher: Select the Publisher.
- Publisher Channel: Select the Publisher Channel.
- Publisher Tags: Select the Publisher Tag.
- Channel Label: Select the Channel Label.
- Publisher Source: Select the Publisher Source.
- Method: Select the Method.
- Current Time: Select the “Yes” option to summarize the data up to the current time for each selected date within the data range.
- Exclude Average: Select the “Yes” option to summarize all data and divide it by the number of days for the selected date range.
- Ping Tree: Select the Ping Tree(s). Note: This filter can be used only if the “Current Time” value filter is set as “No”.
- Ping Tree To Compare: Select the Ping Tree(s) for comparison to those selected via the “Ping Tree” filter field.
- Show Percentage: Check the box to display the performance difference in percentage for the selected date range for each of the selected data columns in the report.
- Show Lead Quality: Check the box to display the comparison of the number of duplicate leads recorded in the system within 1 / 14 / 30 / 45 days for the selected date range.
Click the “Search” button to generate the report.
To create a custom column, click the “Add New Column” button. Note: The custom column creation is available only under the Global Admin and Support system roles. Read more about the Custom Columns in Reports in the Knowledge Base article.
Publisher by State
The “Publisher by State” tab allows you to view and compare the report of the Publishers’ performance across four different time periods for each state (only in the US). The comparison will display the performance data, including both the numerical figures and the corresponding percentage changes.
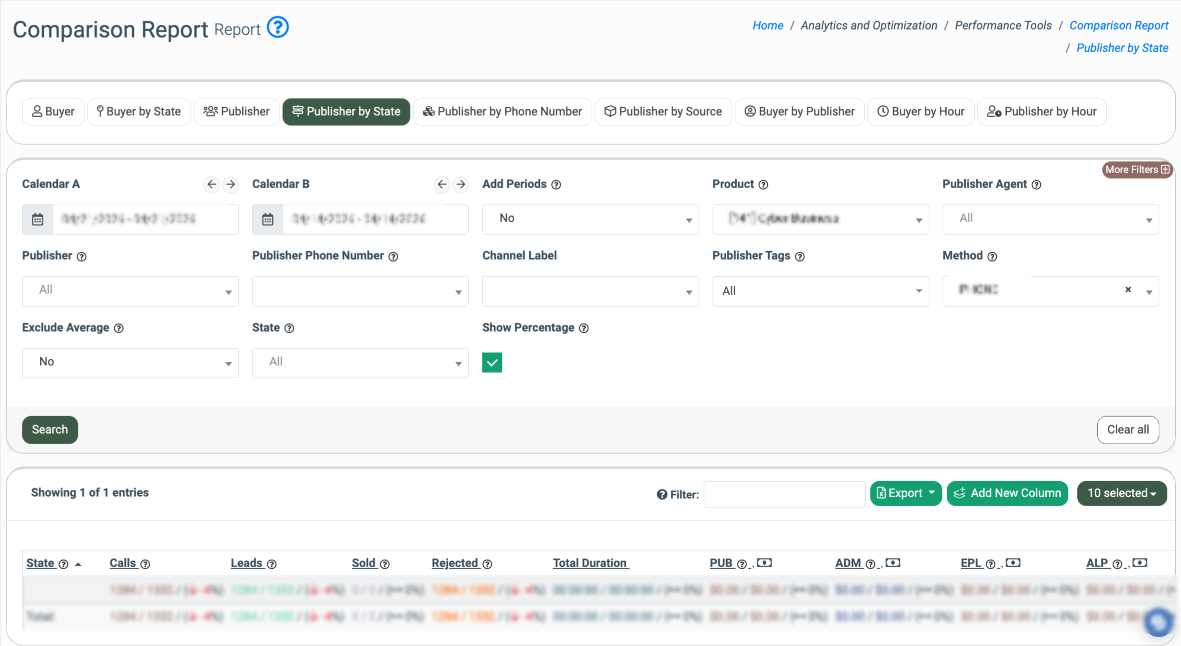
In the generated list, you can see the Publishers’ performance data for each state in the following columns:
- State: The name of the State.
- Pings: The comparison of the number of pings for the chosen time periods.
- Pings Accepted: The comparison of the number of accepted pings for the chosen time periods.
- Post: The comparison of the number of posts for the chosen time periods.
- Leads: The comparison of the number of leads for the chosen time periods.
- Sold: The comparison of the number of sold leads for the chosen time periods.
- Redirects, %: The comparison of redirects number percentage for the chosen time periods.
- Rejected: The comparison of the number of rejected leads for the chosen time periods.
- Total Duration: The total duration of the call.
- PUB: The comparison of the Publisher’s earnings for the chosen time periods.
- ADM: The comparison of the Admin revenue for the chosen time periods.
- EPL: The comparison of the Earning per Lead rates for the chosen time periods.
- ALP: The comparison of the Average per Lead rates for the chosen time periods.
You can narrow down the search results by using the following filters:
- Calendar A: Select the date range for the comparison for Calendar A.
- Calendar B: Select the date range for the comparison for Calendar B.
- Add Periods: Select the “Yes” option to add two additional calendars (the “Calendar C” and the “Calendar D” filter fields).
- Product: Select the Product.
- Publisher Agent: Select the Publisher Agent.
- Publisher: Select the Publisher.
- Publisher Channel: Select the Publisher Channel.
- Publisher Source: Select the Publisher Source.
- Publisher Tags: Select the Publisher Tag.
- Method: Select the Method.
- Exclude Average: Select the “Yes” option to summarize all data and divide it by the number of days for the selected date range.
- State: Select the State.
- Show Percentage: Check the box to display the performance difference in percentage for the selected date range for each of the selected data columns in the report.
Click the “Search” button to generate the report.
To create a custom column, click the “Add New Column” button. Note: The custom column creation is available only under the Global Admin and Support system roles. Read more about the Custom Columns in Reports in the Knowledge Base article.
Publisher by Channel
The “Publisher by Channel” tab allows you to view and compare the report of the Publishers’ performance across four different time periods for each channel. The comparison will display the performance data, including both the numerical figures and the corresponding percentage changes. Note: This tab is available only for the LMS component.
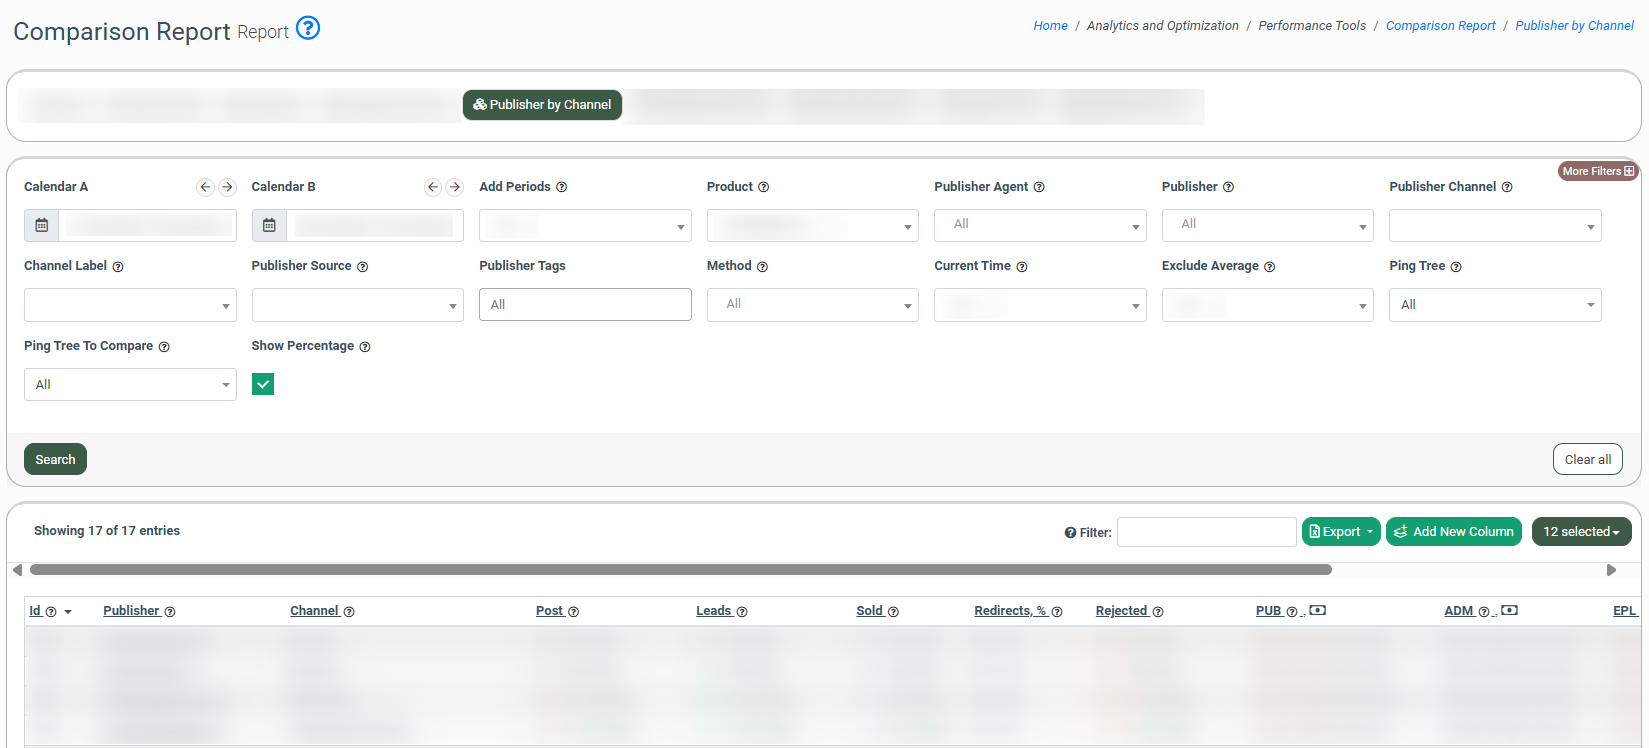
In the generated list, you can see the Publishers’ performance data by Channel in the following columns:
- Id: The unique identification number of the Publisher.
- Publisher: The name and the ID of the Publisher.
- Channel: The name of the Publisher’s Channel.
- Pings: The comparison of the number of pings for the chosen periods.
- Pings Accepted: The comparison of the number of accepted pings for the chosen periods.
- Post: The comparison of the number of posts for the chosen periods.
- Post to Compare: The comparison of the number of posts for the selected periods based on the ping trees chosen through the “Ping Tree To Compare” filter.
Note: This column is only active if a selection is made using the “Ping Tree To Compare” filter. - Post Comparison: The compared ratio between the data in the “Ping” and “Ping to Compare” fields.
Note: This column is only active if a selection is made using the “Ping Tree To Compare” filter. - Leads: The comparison of the number of leads for the chosen periods.
- Leads to Compare: The comparison of the number of leads for the selected periods based on the ping trees chosen through the “Ping Tree To Compare” filter. Note: This column is only active if a selection is made using the “Ping Tree To Compare” filter.
- Leads Comparison: The compared ratio between the data in the “Leads” and “Leads to Compare” fields.
Note: This column is only active if a selection is made using the “Ping Tree To Compare” filter.
- Sold: The comparison of the number of sold leads for the chosen periods.
- Sold to Compare: The comparison of the number of sold leads for the selected periods based on the ping trees chosen through the “Ping Tree To Compare” filter.
Note: This column is only active if a selection is made using the “Ping Tree To Compare” filter.
- Sold Comparison: The compared ratio between the data in the “Sold” and “Sold to Compare” fields.
Note: This column is only active if a selection is made using the “Ping Tree To Compare” filter.
- Redirects, %: The comparison of redirects number percentage for the chosen periods.
- Redirects, % to Compare: The comparison of the number of redirects percentage for the selected periods based on the ping trees chosen through the “Ping Tree To Compare” filter.
Note: This column is only active if a selection is made using the “Ping Tree To Compare” filter.
- Redirects, % Comparison: The compared ratio between the data in the “Redirects, %” and “Redirects, % to Compare” fields.
Note: This column is only active if a selection is made using the “Ping Tree To Compare” filter.
- Rejected: The comparison of the number of rejected leads for the chosen periods.
- Rejected to Compare: The comparison of the number of rejected leads for the selected periods based on the ping trees chosen through the “Ping Tree To Compare” filter.
Note: This column is only active if a selection is made using the “Ping Tree To Compare” filter.
- Rejected Comparison: The compared ratio between the data in the “Rejected” and “Rejected to Compare” fields.
Note: This column is only active if a selection is made using the “Ping Tree To Compare” filter.
- PUB: The comparison of the Publisher’s earnings for the chosen periods.
- PUB to Compare: The comparison of the number of Publisher’s earnings for the selected periods based on the ping trees chosen through the “Ping Tree To Compare” filter.
Note: This column is only active if a selection is made using the “Ping Tree To Compare” filter.
- PUB Comparison: The compared ratio between the data in the “PUB” and “PUB to Compare” fields.
Note: This column is only active if a selection is made using the “Ping Tree To Compare” filter.
- ADM: The comparison of the Admin revenue for the chosen periods.
- ADM to Compare: The comparison of the number of Admin revenue for the selected periods based on the ping trees chosen through the “Ping Tree To Compare” filter.
Note: This column is only active if a selection is made using the “Ping Tree To Compare” filter.
- ADM Comparison: The compared ratio between the data in the “ADM” and “ADM to Compare” fields.
Note: This column is only active if a selection is made using the “Ping Tree To Compare” filter.
- Dup 1 Day, %: The comparison of the number of duplicate leads recorded in the system within the last 24 hours for the chosen periods. Check the box “Show Lead Quality” to display this column.
- Dup 14 Days, %: The comparison of the number of duplicate leads recorded in the system within the past 14 days for the chosen periods. Check the box “Show Lead Quality” to display this column.
- Dup 30 Days, %: The comparison of the number of duplicate leads recorded in the system within the past 30 days for the chosen periods. Check the box “Show Lead Quality” to display this column.
- Dup 45 Days, %: The comparison of the number of duplicate leads recorded in the system within the past 45 days for the chosen periods. Check the box “Show Lead Quality” to display this column.
- EPL: The comparison of the Earnings per Lead rates for the chosen periods.
- EPL to Compare: The comparison of the Earnings per Lead rates for the selected periods based on the ping trees chosen through the “Ping Tree To Compare” filter.
Note: This column is only active if a selection is made using the “Ping Tree To Compare” filter.
- EPL Comparison: The compared ratio between the data in the “EPL” and “EPL to Compare” fields.
Note: This column is only active if a selection is made using the “Ping Tree To Compare” filter.
- ALP: The comparison of the Average per Lead rates for the chosen periods.
- ALP to Compare: The comparison of the Average per Lead rates for the selected periods based on the ping trees chosen through the “Ping Tree To Compare” filter.
Note: This column is only active if a selection is made using the “Ping Tree To Compare” filter.
- ALP Comparison: The compared ratio between the data in the “ALP” and “ALP to Compare” fields.
Note: This column is only active if a selection is made using the “Ping Tree To Compare” filter.
You can narrow down the search results by using the following filters:
- Calendar A: Select the date range for the comparison for Calendar A.
- Calendar B: Select the date range for the comparison for Calendar B.
- Add Periods: Select the “Yes” option to add two additional calendars (the “Calendar C” and the “Calendar D” filter fields).
- Product: Select the Product.
- Publisher Agent: Select the Publisher Agent.
- Publisher: Select the Publisher.
- Publisher Channel: Select the Publisher Channel.
- Channel Label: Select the Channel Label.
- Publisher Source: Select the Publisher Source.
- Publisher Tags: Select the Publisher Tag.
- Method: Select the Method.
- Current Time: Select the “Yes” option to summarize the data up to the current time for each selected date within the data range.
- Exclude Average: Select the “Yes” option to summarize all data and divide it by the number of days for the selected date range.
- Ping Tree: Select the Ping Tree(s). Note: This filter can be used only if the “Current Time” value filter is set as “No”.
- Ping Tree To Compare: Select the Ping Tree(s) for comparison to those selected via the “Ping Tree” filter field.
- Show Percentage: Check the box to display the performance difference in percentage for the selected date range for each of the selected data columns in the report.
- Show Lead Quality: Check the box to display the comparison of the number of duplicate leads recorded in the system within 1 / 14 / 30 / 45 days for the selected date range.
Click the “Search” button to generate the report.
To create a custom column, click the “Add New Column” button. Note: The custom column creation is available only under the Global Admin and Support system roles. Read more about the Custom Columns in Reports in the Knowledge Base article.
Publisher by Phone Number
The “Publisher by Phone Number” tab provides a detailed comparison of Publisher performance grouped by phone number. This report helps identify which phone numbers generate the highest volume and revenue, enabling you to monitor traffic sources more effectively and detect performance trends across different periods. Note: This tab is available only for the Call logic component.
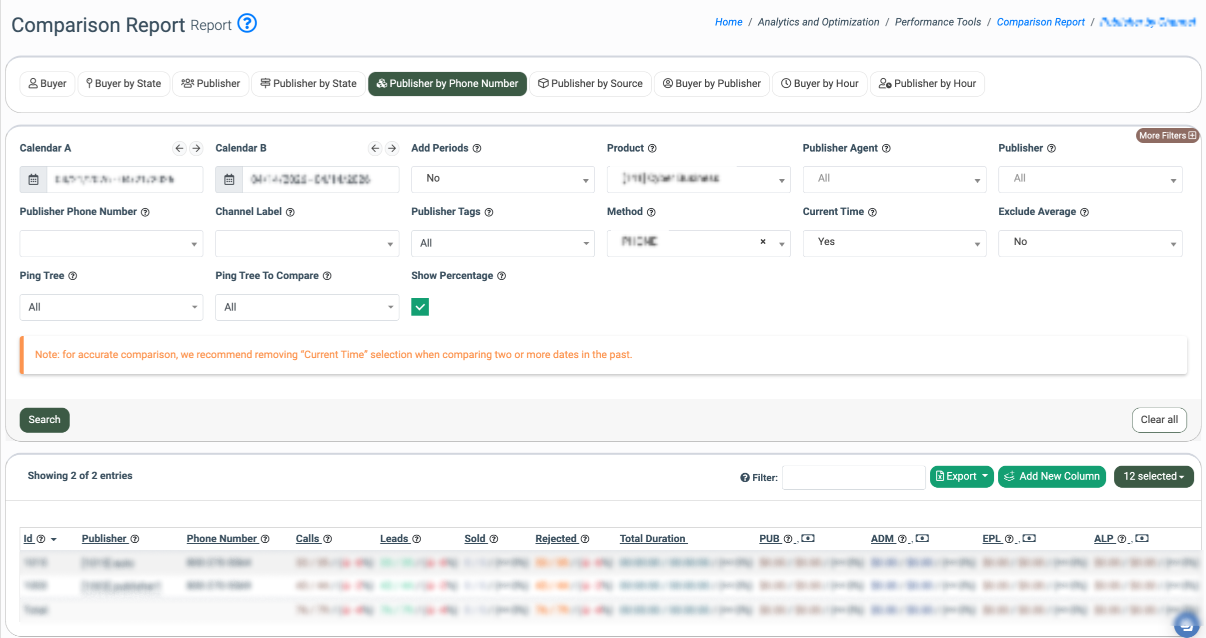
In the generated list, you can see the Publisher performance data by phone number in the following columns:
- Id: The unique identification number of the record.
- Publisher: The ID and name of the Publisher.
- Phone Number: The phone number.
- Calls: The comparison of the number of calls for the chosen periods.
- Calls to Compare: The comparison of the number of calls for the selected periods based on the ping trees chosen through the “Ping Tree To Compare” filter.
Note: This column is only active if a selection is made using the “Ping Tree To Compare” filter.
- Calls Comparison: The compared ratio between the data in the “Calls” and “Calls to Compare” fields.
Note: This column is only active if a selection is made using the “Ping Tree To Compare” filter.
- Leads: The comparison of the number of leads for the chosen periods.
- Leads to Compare: The comparison of the number of leads for the selected periods based on the ping trees chosen through the “Ping Tree To Compare” filter.
Note: This column is only active if a selection is made using the “Ping Tree To Compare” filter.
- Leads Comparison: The compared ratio between the data in the “Leads” and “Leads to Compare” fields.
Note: This column is only active if a selection is made using the “Ping Tree To Compare” filter.
- Sold: The comparison of the number of sold leads for the chosen periods.
- Sold to Compare: The comparison of the number of sold leads for the selected periods based on the ping trees chosen through the “Ping Tree To Compare” filter.
Note: This column is only active if a selection is made using the “Ping Tree To Compare” filter.
- Sold Comparison: The compared ratio between the data in the “Sold” and “Sold to Compare” fields.
- Rejected: The comparison of the number of rejected leads for the chosen periods.
- Rejected to Compare: The comparison of the number of rejected leads for the selected periods based on the ping trees chosen through the “Ping Tree To Compare” filter.
Note: This column is only active if a selection is made using the “Ping Tree To Compare” filter.
- Rejected Comparison: The compared ratio between the data in the “Rejected” and “Rejected to Compare” fields.
Note: This column is only active if a selection is made using the “Ping Tree To Compare” filter.
- Total Duration: The total duration of the call.
- PUB: The comparison of the Publisher’s earnings for the chosen periods.
- PUB to Compare: The comparison of the number of Publisher’s earnings for the selected periods based on the ping trees chosen through the “Ping Tree To Compare” filter.
Note: This column is only active if a selection is made using the “Ping Tree To Compare” filter.
- PUB Comparison: The compared ratio between the data in the “PUB” and “PUB to Compare” fields.
Note: This column is only active if a selection is made using the “Ping Tree To Compare” filter.
- ADM, $: The comparison of the Admin revenue for the chosen periods.
- ADM to Compare: The comparison of the number of Admin revenue for the selected periods based on the ping trees chosen through the “Ping Tree To Compare” filter.
Note: This column is only active if a selection is made using the “Ping Tree To Compare” filter.
- ADM Comparison: The compared ratio between the data in the “ADM” and “ADM to Compare” fields.
Note: This column is only active if a selection is made using the “Ping Tree To Compare” filter.
- EPL, $: The comparison of the Earnings per Lead rates for the chosen periods.
- EPL to Compare: The comparison of the Earnings per Lead rates for the selected periods based on the ping trees chosen through the “Ping Tree To Compare” filter.
Note: This column is only active if a selection is made using the “Ping Tree To Compare” filter.
- EPL Comparison: The compared ratio between the data in the “EPL” and “EPL to Compare” fields.
Note: This column is only active if a selection is made using the “Ping Tree To Compare” filter.
- ALP, $: The comparison of the Average per Lead rates for the chosen periods.
- ALP to Compare: The comparison of the Average per Lead rates for the selected periods based on the ping trees chosen through the “Ping Tree To Compare” filter.
Note: This column is only active if a selection is made using the “Ping Tree To Compare” filter.
- ALP Comparison: The compared ratio between the data in the “ALP” and “ALP to Compare” fields.
Note: This column is only active if a selection is made using the “Ping Tree To Compare” filter.
You can narrow down the search results by using the following filters:
- Calendar A: Select the date range for the comparison for Calendar A.
- Calendar B: Select the date range for the comparison for Calendar B.
- Add Periods: Select the “Yes” option to add two additional calendars (the “Calendar C” and the “Calendar D” filter fields).
- Product: Select the Product.
- Publisher Agent: Select the Publisher Agent.
- Publisher: Select the Publisher.
- Publisher Phone Number: Enter the phone number of the Publisher.
- Channel Label: Select the Channel Label.
- Publishers Tags: Select the Publisher Tag(s).
- Method: Select the lead posting method.
- Current Time: Select the “Yes” option to summarize the data up to the current time for each selected date within the data range.
- Exclude Average: Select the “Yes” option to summarize all data and divide it by the number of days for the selected date range.
- Ping Tree: Select the Ping Tree(s). Note: This filter can be used only if the “Current Time” value filter is set as “No”.
- Ping Tree To Compare: Select the Ping Tree(s) for comparison to those selected via the “Ping Tree” filter field.
- Show Percentage: Check the box to display the performance difference in percentage for the selected date range for each of the selected data columns in the report.
- Show Lead Quality: Check the box to display the comparison of the number of duplicate leads recorded in the system within 1 / 14 / 30 / 45 days for the selected date range.
Click the “Search” button to generate the report.
To create a custom column, click the “Add New Column” button. Note: The custom column creation is available only under the Global Admin and Support system roles. Read more about the Custom Columns in Reports in the Knowledge Base article.
Publisher by Source
The “Publisher by Source” tab allows you to view and compare the report on the Publishers’ performance across four different periods for each source. The comparison will display the performance data, including both the numerical figures and the corresponding percentage changes.
There is a limit set to 1000 on the number of sources displayed in the report. If the data fits on one page, the Total is displayed, and sorting by columns is available. However, if the data spans multiple pages, pagination is used, and both the Total display and sorting are disabled.
Note: When there are a lot of sources and the report shows a “No records” message, select the Publisher and click the “Search” button.
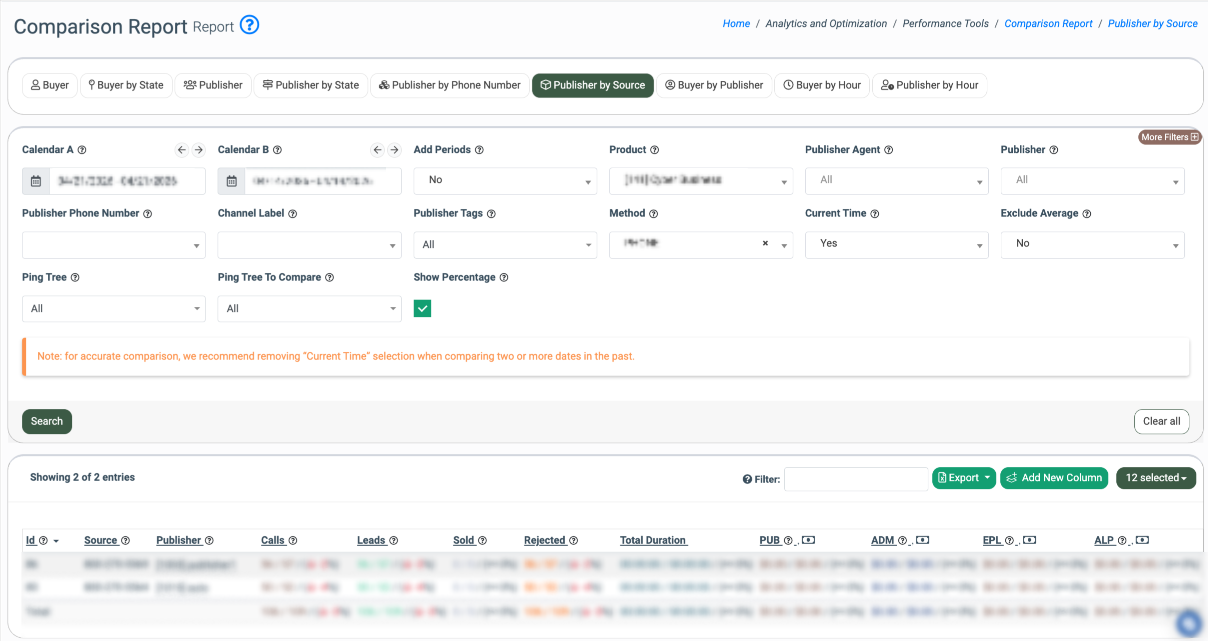
In the generated list, you can see the Publisher performance data by source in the following columns:
- Id: The unique identification number of the record.
- Source: The name of the source.
- Publisher: The ID and name of the Publisher.
- Post: The comparison of the number of posts for the chosen periods.
- Post to Compare: The comparison of the number of posts for the selected periods based on the ping trees chosen through the “Ping Tree To Compare” filter.
Note: This column is only active if a selection is made using the “Ping Tree To Compare” filter. - Post Comparison: The compared ratio between the data in the “Ping” and “Ping to Compare” fields.
Note: This column is only active if a selection is made using the “Ping Tree To Compare” filter. - Pings: The comparison of the number of pings for the chosen periods.
- Pings Accepted: The comparison of the number of accepted pings for the chosen periods.
- Presented: The comparison of the number of leads (posts) for the chosen periods.
- Leads: The comparison of the number of leads for the chosen periods.
- Leads to Compare: The comparison of the number of leads for the selected periods based on the ping trees chosen through the “Ping Tree To Compare” filter. Note: This column is only active if a selection is made using the “Ping Tree To Compare” filter.
- Leads Comparison: The compared ratio between the data in the “Leads” and “Leads to Compare” fields.
Note: This column is only active if a selection is made using the “Ping Tree To Compare” filter.
- Sold: The comparison of the number of sold leads for the chosen periods.
- Sold to Compare: The comparison of the number of sold leads for the selected periods based on the ping trees chosen through the “Ping Tree To Compare” filter.
Note: This column is only active if a selection is made using the “Ping Tree To Compare” filter.
- Sold Comparison: The compared ratio between the data in the “Sold” and “Sold to Compare” fields.
Note: This column is only active if a selection is made using the “Ping Tree To Compare” filter.
- Redirects, %: The comparison of redirects number percentage for the chosen periods.
- Redirects, % to Compare: The comparison of the number of redirects percentage for the selected periods based on the ping trees chosen through the “Ping Tree To Compare” filter.
Note: This column is only active if a selection is made using the “Ping Tree To Compare” filter.
- Redirects, % Comparison: The compared ratio between the data in the “Redirects, %” and “Redirects, % to Compare” fields.
Note: This column is only active if a selection is made using the “Ping Tree To Compare” filter.
- Rejected: The comparison of the number of rejected leads for the chosen periods.
- Rejected to Compare: The comparison of the number of rejected leads for the selected periods based on the ping trees chosen through the “Ping Tree To Compare” filter.
Note: This column is only active if a selection is made using the “Ping Tree To Compare” filter. - Rejected Comparison: The compared ratio between the data in the “Rejected” and “Rejected to Compare” fields.
Note: This column is only active if a selection is made using the “Ping Tree To Compare” filter. - Total Duration: The total duration of the call.
- PUB: The comparison of the Publisher’s earnings for the chosen periods.
- PUB to Compare: The comparison of the number of Publisher’s earnings for the selected periods based on the ping trees chosen through the “Ping Tree To Compare” filter.
Note: This column is only active if a selection is made using the “Ping Tree To Compare” filter.
- PUB Comparison: The compared ratio between the data in the “PUB” and “PUB to Compare” fields.
Note: This column is only active if a selection is made using the “Ping Tree To Compare” filter.
- ADM, $: The comparison of the Admin revenue for the chosen periods.
- ADM to Compare: The comparison of the number of Admin revenue for the selected periods based on the ping trees chosen through the “Ping Tree To Compare” filter.
Note: This column is only active if a selection is made using the “Ping Tree To Compare” filter.
- ADM Comparison: The compared ratio between the data in the “ADM” and “ADM to Compare” fields.
Note: This column is only active if a selection is made using the “Ping Tree To Compare” filter.
- EPL, $: The comparison of the Earnings per Lead rates for the chosen periods.
- EPL to Compare: The comparison of the Earnings per Lead rates for the selected periods based on the ping trees chosen through the “Ping Tree To Compare” filter.
Note: This column is only active if a selection is made using the “Ping Tree To Compare” filter.
- EPL Comparison: The compared ratio between the data in the “EPL” and “EPL to Compare” fields.
Note: This column is only active if a selection is made using the “Ping Tree To Compare” filter.
- ALP, $: The comparison of the Average per Lead rates for the chosen periods.
- ALP to Compare: The comparison of the Average per Lead rates for the selected periods based on the ping trees chosen through the “Ping Tree To Compare” filter.
Note: This column is only active if a selection is made using the “Ping Tree To Compare” filter.
- ALP Comparison: The compared ratio between the data in the “ALP” and “ALP to Compare” fields.
Note: This column is only active if a selection is made using the “Ping Tree To Compare” filter.
- Calendar A: Select the date range for the comparison for Calendar A.
- Calendar B: Select the date range for the comparison for Calendar B.
- Add Periods: Select the “Yes” option to add two additional calendars (the “Calendar C” and the “Calendar D” filter fields).
- Product: Select the Product.
- Publisher Agent: Select the Publisher Agent.
- Publisher: Select the Publisher.
- Publisher Channel: Select the Publisher Channel.
- Channel Label: Select the Channel Label.
- Publisher Source: Select the Publisher Source.
- Publisher Tags: Select the Publisher Tag.
- Method: Select the Method.
- Current Time: Select the “Yes” option to summarize the data up to the current time for each selected date within the data range.
- Exclude Average: Select the “Yes” option to summarize all data and divide it by the number of days for the selected date range.
- Ping Tree: Select the Ping Tree(s). Note: This filter can be used only if the “Current Time” value filter is set as “No”.
- Ping Tree To Compare: Select the Ping Tree(s) for comparison to those selected via the “Ping Tree” filter field.
- Show Percentage: Check the box to display the performance difference in percentage for the selected date range for each of the selected data columns in the report.
- Show Lead Quality: Check the box to display the comparison of the number of duplicate leads recorded in the system within 1 / 14 / 30 / 45 days for the selected date range.
Click the “Search” button to generate the report.
To create a custom column, click the “Add New Column” button. Note: The custom column creation is available only under the Global Admin and Support system roles. Read more about the Custom Columns in Reports in the Knowledge Base article.
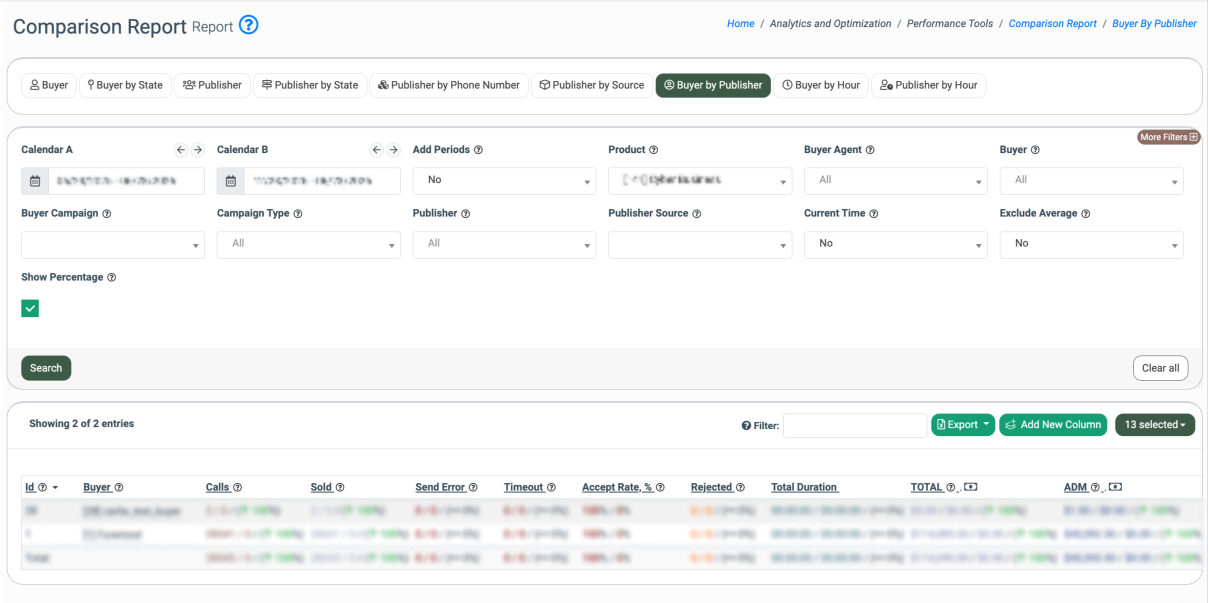
Buyer by Publisher
The “Buyer by Publisher” tab allows you to view and compare the Buyers’ performance sorted by Publishers across four different time periods. The comparison will display the performance data, including both the numerical figures and the corresponding percentage changes.
-2.png?hsLang=en)
In the generated list, you can see the Buyers’ performance data by Publisher in the following columns:
- Id: The unique identification number of the Buyer.
- Buyer: The name and the ID of the Buyer.
- Pings: The comparison of the number of pings for the chosen time periods.
- Pings Accepted: The comparison of the number of accepted pings for the chosen time periods.
- Presented: The comparison of the number of leads (posts) for the chosen time periods.
- Sold: The comparison of the number of the sold leads (accepts) for the chosen time periods.
- Send Error: The comparison of the number of posting errors for the chosen time periods.
- Timeout: The comparison of the number of leads with timeout status for the chosen time periods.
- Redirects, %: The comparison of redirects number percentage for the chosen time periods.
- Accept Rate, %: The comparison of the percentage ratio of sold leads (accepts) to the total number of leads (posts) for the chosen time periods.
- Rejected: The comparison of the number of rejected leads for the chosen time periods.
- Total Duration: The total duration of the call.
- TOTAL: The comparison of the total revenue for the chosen time periods.
- ADM: The comparison of the Admin revenue for the chosen time periods.
- CPL: The comparison of the Cost per Lead rates for the chosen time periods.
- ALP: The comparison of the Average per Lead rates for the chosen time periods.
You can narrow down the search results by using the following filters:
- Calendar A: Select the date range for the comparison for Calendar A.
- Calendar B: Select the date range for the comparison for Calendar B.
- Add Periods: Select the “Yes” option to add two additional calendars (the “Calendar C” and the “Calendar D” filter fields).
- Product: Select the Product.
- Buyer Agent: Select the Buyer Agent.
- Buyer: Select the Buyer.
- Buyer Campaign: Select the Campaign of the particular Buyer.
- Buyer Tags: Select the Buyer Tag.
- Campaign Type: Select the Campaign type (ExitOffer / Redirect / Silent / Smart Tree).
- Campaign Tags: Select the Campaign Tag.
- Publisher: Select the Publisher.
- Publisher Source: Select the Publisher Source.
- Current Time: Select the “Yes” option to summarize the data up to the current time for each selected date within the data range.
- Exclude Average: Select the “Yes” option to summarize all data and divide it by the number of days for the selected date range.
- Show Percentage: Check the box to display the performance difference in percentage for the selected date range for each of the selected data columns in the report.
Click the “Search” button to generate the report.
To create a custom column, click the “Add New Column” button. Note: The custom column creation is available only under the Global Admin and Support system roles. Read more about the Custom Columns in Reports in the Knowledge Base article.
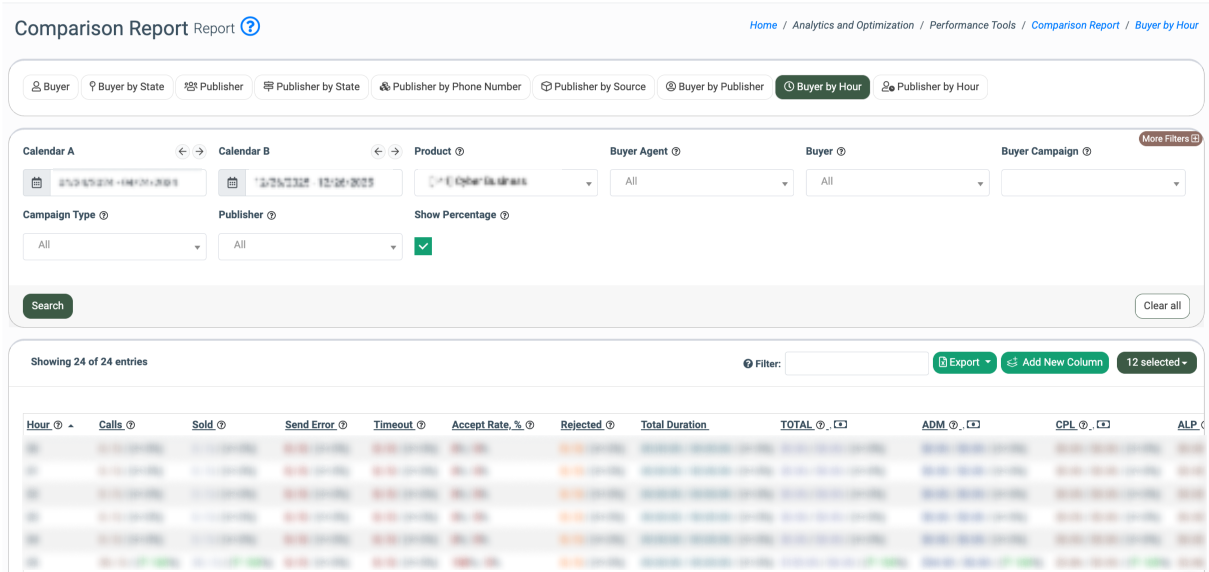
Buyer by Hour
The “Buyer by Hour” tab allows you to view and compare the hourly performance of Buyers across two different time periods. The comparison will display the performance data, including both the numerical figures and the corresponding percentage changes.
-1.png?hsLang=en)
In the generated list, you can see the Buyers’ performance data for each hour in the following columns:
- Hour: The particular hour.
- Pings: The comparison of the number of pings for the chosen time periods.
- Pings Accepted: The comparison of the number of accepted pings for the chosen time periods.
- Presented: The comparison of the number of leads (posts) for the chosen time periods.
- Sold: The comparison of the number of the sold leads (accepts) for the chosen time periods.
- Send Error: The comparison of the number of posting errors for the chosen time periods.
- Timeout: The comparison of the number of leads with timeout status for the chosen time periods.
- Redirects, %: The comparison of redirects number percentage for the chosen time periods.
- Accept Rate, %: The comparison of the percentage ratio of sold leads (accepts) to the total number of leads (posts) for the chosen time periods.
- Rejected: The comparison of the number of rejected leads for the chosen time periods.
- Total Duration: The total duration of the call.
- TOTAL: The comparison of the total revenue for the chosen time periods.
- ADM: The comparison of the Admin revenue for the chosen time periods.
- CPL: The comparison of the Cost per Lead rates for the chosen time periods.
- ALP: The comparison of the Average per Lead rates for the chosen time periods.
You can narrow down the search results by using the following filters:
- Calendar A: Select the date range for the comparison for Calendar A.
- Calendar B: Select the date range for the comparison for Calendar B.
- Product: Select the Product.
- Buyer Agent: Select the Buyer Agent
- Buyer: Select the Buyer.
- Buyer Campaign: Select the Campaign of the particular Buyer.
- Buyer Tags: Select the Buyer Tag.
- Campaign Type: Select the Campaign type (ExitOffer / Redirect / Silent / Smart Tree).
- Campaign Tags: Select the Campaign Tag.
- Publisher: Select the Publisher.
- Show Percentage: Check the box to display the performance difference in percentage for the selected date range for each of the selected data columns in the report.
Click the “Search” button to generate the report.
To create a custom column, click the “Add New Column” button. Note: The custom column creation is available only under the Global Admin and Support system roles. Read more about the Custom Columns in Reports in the Knowledge Base article.
Publisher by Hour
The “Publisher by Hour” tab allows you to view and compare the hourly performance of publishers across two different time periods. The comparison will display the performance data, including both the numerical figures and the corresponding percentage changes.
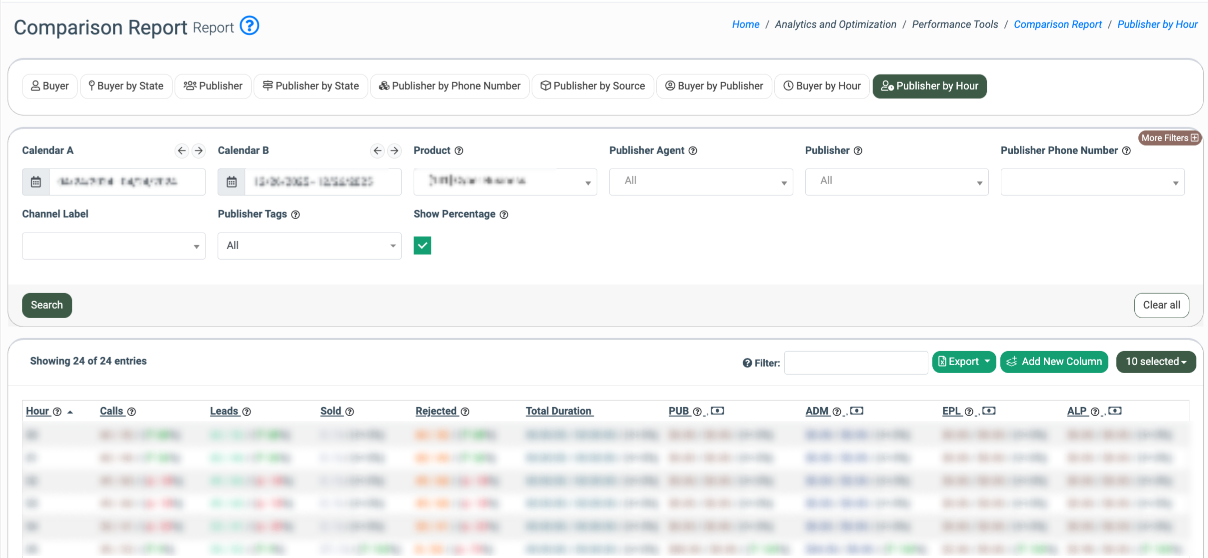
In the generated list, you can see the Publishers’ performance data for each hour in the following columns:
- Hour: The particular hour.
- Pings: The comparison of the number of pings for the chosen time periods.
- Pings Accepted: The comparison of the number of accepted pings for the chosen time periods.
- Post: The comparison of the number of posts for the chosen time periods.
- Leads: The comparison of the number of leads for the chosen time periods.
- Sold: The comparison of the number of sold leads for the selected date ranges.
- Redirects, %: The comparison of redirect percentage for the chosen time periods.
- Rejected: The comparison of the number of rejected leads for the chosen time periods.
- Total Duration: The total duration of the call.
- PUB: The comparison of the Publisher earnings for the chosen time periods.
- ADM: The comparison of the Admin revenue for the chosen time periods.
- EPL: The comparison of the Earnings per Lead rates for the chosen time periods.
- ALP: The comparison of the Average Lead Price rates for the chosen time periods.
You can narrow down the search results by using the following filters:
- Calendar A: Select the date range for the comparison for Calendar A.
- Calendar B: Select the date range for the comparison for Calendar B.
- Product: Select the Product.
- Publisher Agent: Select the Publisher Agent.
- Publisher: Select the Publisher.
- Publisher Channel: Select the Publisher Channel.
- Publisher Source: Select the Publisher Source.
- Publisher Tags: Select the Publisher Tag.
- Show Percentage: Check the box to display the performance difference in percentage for the selected date ranges for each of the selected data columns in the report.
Click the “Search” button to generate the report.
To create a custom column, click the “Add New Column” button. Note: The custom column creation is available only under the Global Admin and Support system roles. Read more about the Custom Columns in Reports in the Knowledge Base article.