To open the “Comparison Report,” go to the All Reports > Mailing Reports > Comparison Report section. The data is displayed in graph form.
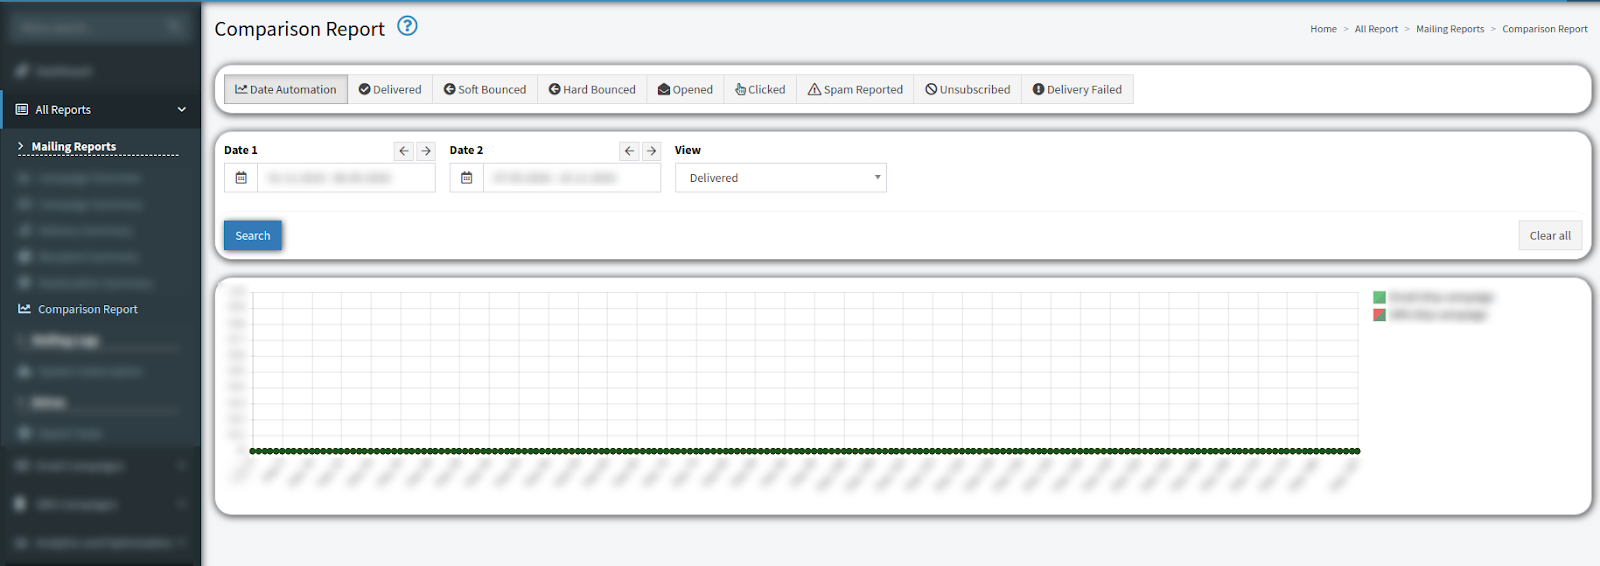
The “Comparison Report” contains eight separate tabs. Each tab represents a delivery event:
-
Delivered: The number of delivered emails.
-
Soft Bounced: The total number of emails from all Campaigns that were not delivered due to email service issues.
-
Hard Bounced: The total number of emails from all Campaigns that were not delivered due to email address issues.
-
Opened: The number of emails that were opened by the recipients.
-
Clicked: The total number of email link clicks.
-
Spam Reported: The total number of emails that users marked as “Spam.”
-
Unsubscribed: The total number of unsubscribed emails.
-
Delivery Failed: The number of emails that were not delivered.
You can narrow down the search results by using the following filters:
-
Date 1: Select the date range for the report.
-
Date 2: Select another date range for comparison.
-
View: Select the specific metric for comparison (Delivered, Soft Bounced, Hard Bounced, Opened, Clicked, Spam Reported, Unsubscribed, Delivery Failed).
In the “Date Automation” tab, you can select the timeframes and metrics for comparison. Use the checkboxes next to the metrics name on the right side of the graph legend to add or remove the values.