Note: The page stats are based on the recorded sessions only.
To view the Dashboard section, go to the left sidebar and click on Dashboard at the top of the menu.
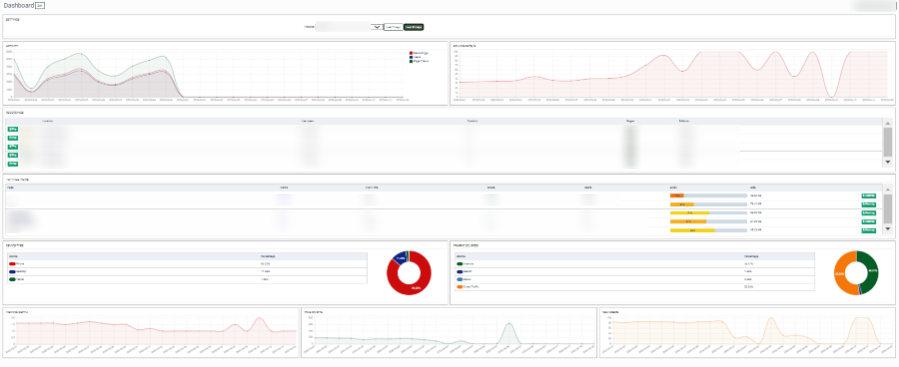
The Dashboard contains the following information:
-
Activity: The number of recordings, users, and page views.
-
Bounce rate, %: The percentage of users who opted out of browsing the website (the user gets to the website but does not make clicks and closes the web page in less than 15 seconds).
-
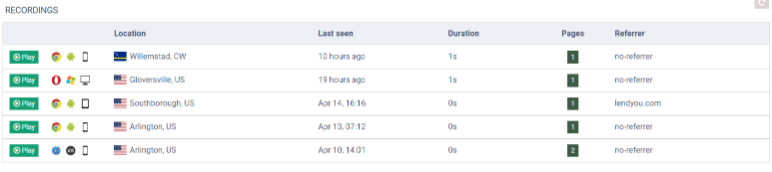
Recordings: This widget displays information about the latest website visitors.
-
Play: The “Play” button displays all the pages the user viewed and actions or clicks made.
-
Location: The location of the user.
-
Last seen: Date and time when the user last visited the website.
-
Duration: The session duration. The Duration shows how much time the client from a specific state, who works on a specific device with a specific OS, spent on the website.
-
Pages: The number of pages viewed.
-
Referrer: The previous website that sent the user to your webpage.
-
-
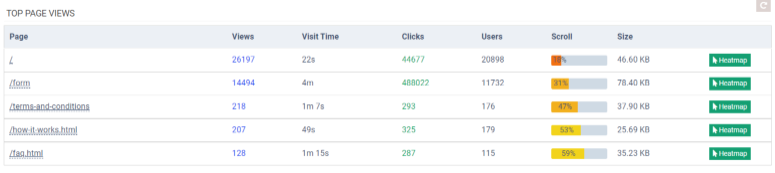
Top page views: This widget displays information about the stats on certain web pages.
-
Page: The URL of the page.
-
Views: The number of page views for the selected date range.
-
Avg. Duration: The average duration on the page.
-
Clicks: The number of clicks on the page for the selected date range (7 days, 30 days).
-
Users: The number of unique users who visited the page within a certain time (7 days, 30 days).
-
Scrolls: The average percentage of the web page viewed by users.
-
Size: The size of the page.
-
Top page views: This widget displays information about the stats on certain web pages.
-
Page: The URL of the page.
-
Views: The number of page views for the selected date range.
-
Avg. Duration: The average duration on the page.
-
Clicks: The number of clicks on the page for the selected date range (7 days, 30 days).
-
Users: The number of unique users who visited the page within a certain time (7 days, 30 days).
-
Scrolls: The average percentage of the web page viewed by users.
-
Size: The size of the page.
To view the click map on the page, click the “Heatmap” button.
-
Device type: The percentage of devices from which users visit the website.
-
Device: The name of the device (Desktop, mobile, tablet).
-
Percentage: The percentage of the total devices used for the website.
-
-
Traffic sources: Percentage of the resources from which users come to the site.
-
Source: The source from which users came to our site.
-
Percentage: The percentage of users who came to our site from different sources.
-
-
Viewing depth: An average website browsing depth measured in pages. The depth is calculated by the number of pages viewed divided by the number of users.
-
Time on site: An average time a user spends on the website.
-
New Users: The number of new users who visited the website.
- Device type: The percentage of devices from which users visit the website.
-
Device: The name of the device (Desktop, mobile, tablet).
-
Percentage: The percentage of the total devices used for the website.
- Traffic sources: Percentage of the resources from which users come to the site.
-
Source: The source from which users came to our site.
-
Percentage: The percentage of users who came to our site from different sources.
- Viewing depth: An average website browsing depth measured in pages. The depth is calculated by the number of pages viewed divided by the number of users.
- Time on site: An average time a user spends on the website.
- New Users: The number of new users who visited the website.