To access, go to the Fraud and Anomaly > Data Insights section.
Overview
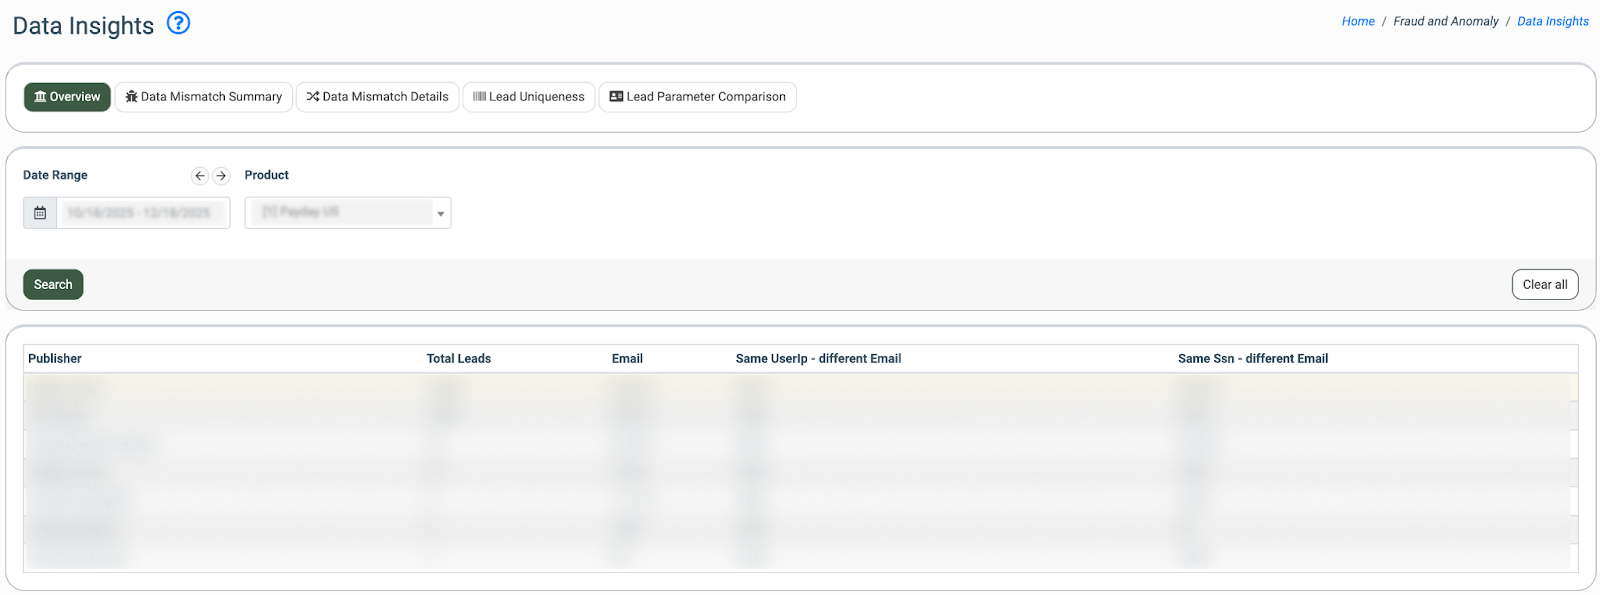
The Overview tab allows admin users to monitor specific Publishers for fraudulent activity. The report provides a summary overview of Publishers based on lead uniqueness, according to the specific parameters set by the Product.
You can narrow down the search results by using the following filters:
- Date Range: Select the date range for the report.
- Product: Select the Product.
The report contains the following information:
- Publisher: The name of the Publisher.
- Total Leads: The total number of leads for the selected period.
The rest of the report may contain various parameters depending on the selected Product. Example:
- Email: The percentage ratio of unique emails.
- Same UserIp - different Email: The percentage ratio of different emails with the same IP address.
- Same Ssn - different Email: The percentage ratio of different emails with the same SSN.
Data Mismatch Summary
The Data Mismatch Summary tab allows you to view a percentage ratio for selected parameters. It includes a table with pie charts in each cell, highlighting cases where lead data is inconsistent, such as the same User IP with different email addresses, the same email with different bank account numbers, and so on. 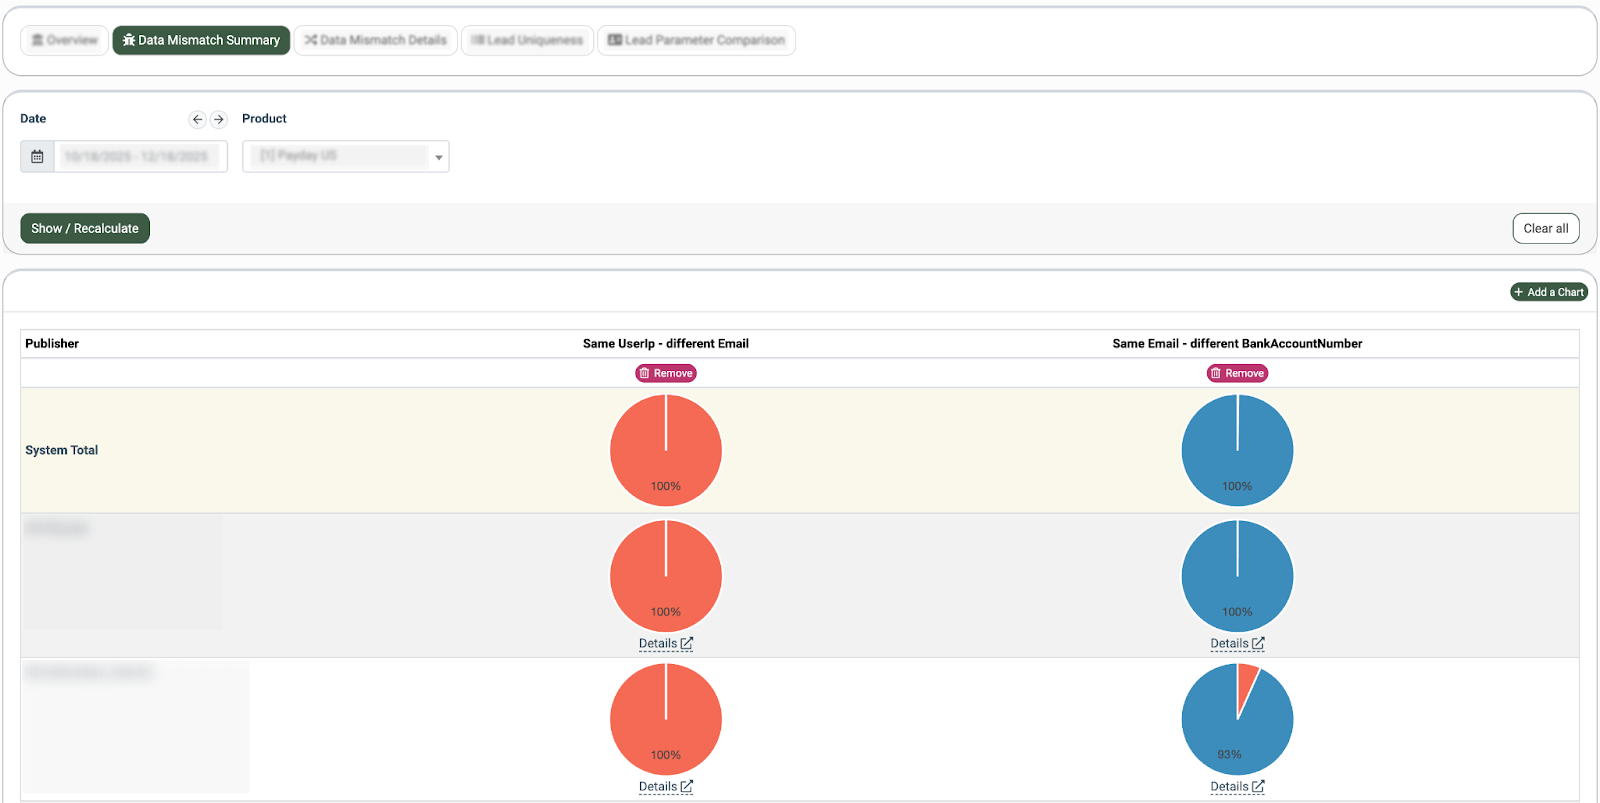
You can narrow down the search results by using the following filters:
- Date: Select the date range for the report.
- Product: Select the Product.
Click the “Show/Recalculate” button to display the charts. Note: The charts display data after being added via the “Add a Chart” button. Please see below for instructions on adding the charts.
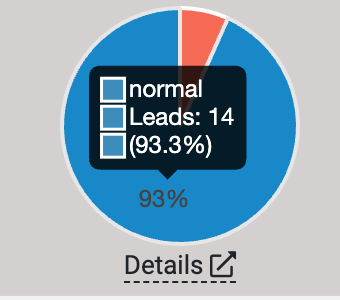
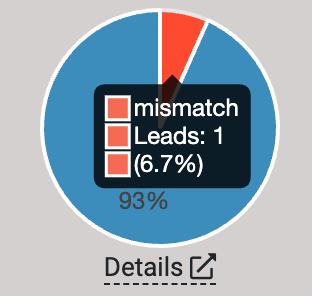
When you hover over a chart with the cursor, the normal data corresponding to lead uniqueness is highlighted in blue, while mismatched data is highlighted in red.
Click the “Details” button to check the mismatch data for the specific leads. The system will redirect you to the “Data Mismatch Details” tab.
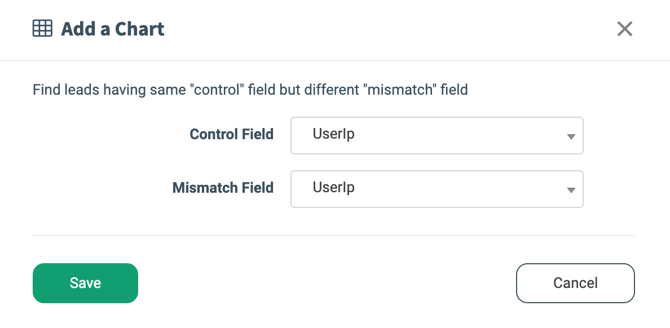
To check a specific parameter, click the “Add a Chart” button. Fill in the following fields in the pop-up window:
- Control Field: Select a parameter to identify the duplicates for.
- Mismatch Field: Select the parameter against which the comparison is done.
Click the “Save” button.
To remove the existing chart, click the “Remove” button. Then confirm the action in the pop-up window.
Data Mismatch Details
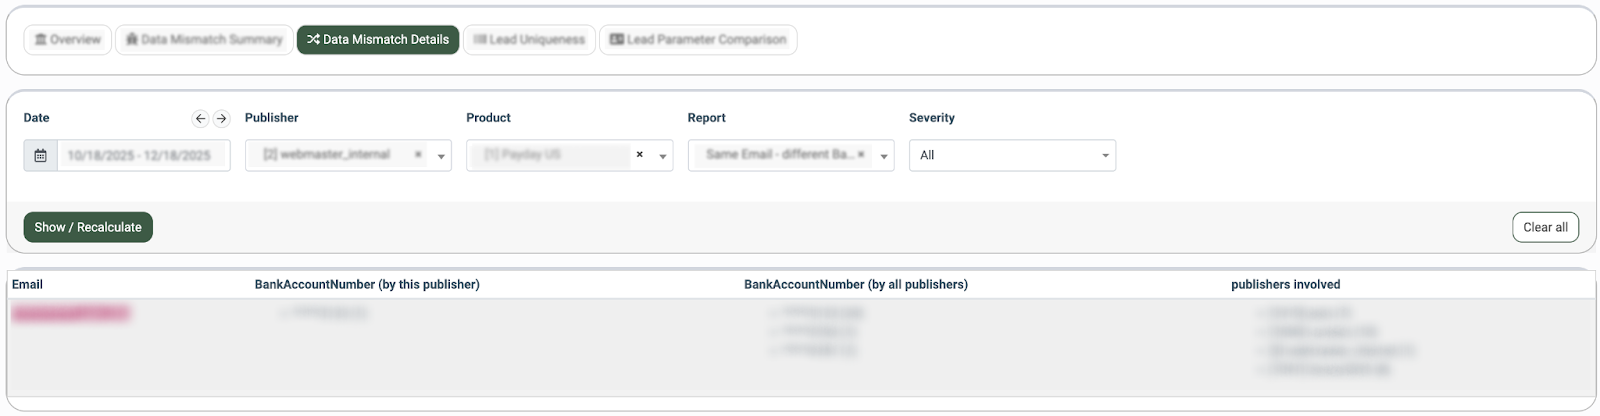
The Data Mismatch Details tab provides a detailed, record-level view of detected data inconsistencies. The table breaks down each mismatch by control value, mismatched values across publishers, and the publishers involved, enabling deeper analysis and faster identification of potential fraud or data quality issues.
You can narrow down the search results by using the following filters:
- Date: Select the date range for the report.
- Publisher: Select a Publisher.
- Product: Select a Product.
- Report: Select the list of parameters to compare (corresponds to the chart selection in the “Data Mismatch Summary” tab).
- Severity: The mismatch severity level (Critical / Warning / Medium / Low).
The report contains the following information:
- Control Field: The parameter according to which the duplicates are found.
- Mismatch Field (by this Publisher): The parameter against which the comparison is done for the selected Publisher.
- Mismatch Field (by all Publishers): The parameter against which the comparison is done for all the Publishers.
- Publishers Involved: The Publishers through which the lead has entered the system.
Lead Uniqueness
The Lead Uniqueness tab allows you to check a percentage ratio of unique leads for each Publisher based on specific parameters defined by the Product, represented through pie charts.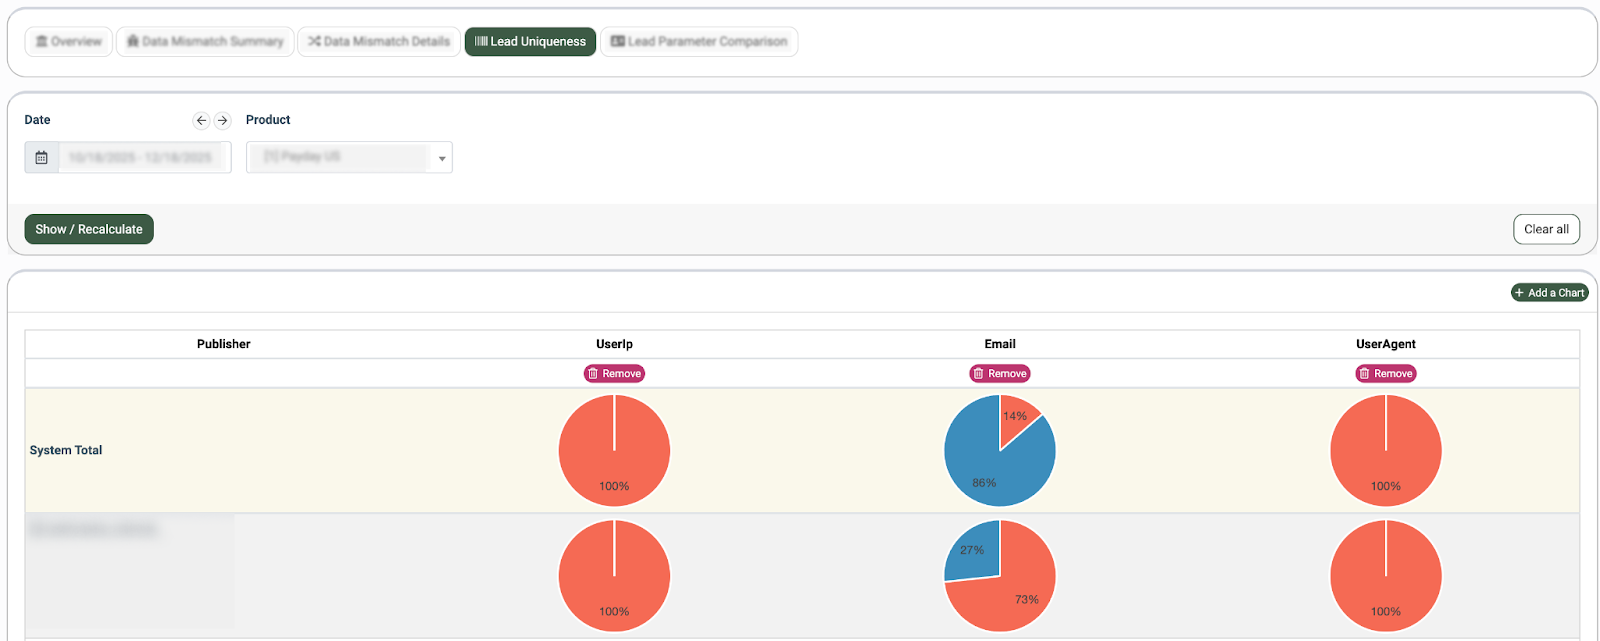
You can narrow down the search results by using the following filters:
- Date: Select the date range for the report.
- Product: Select a Product.
Click the “Show/Recalculate” button to display the charts. Note: The charts display data after being added via the “Add a Chart” button. Please see below for instructions on adding the charts.
When you hover over a chart with the cursor, the normal data corresponding to lead uniqueness is highlighted in blue, while duplicate data is highlighted in red.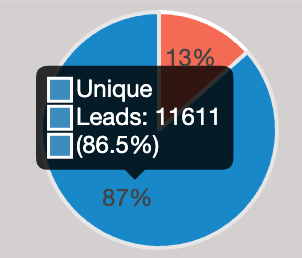
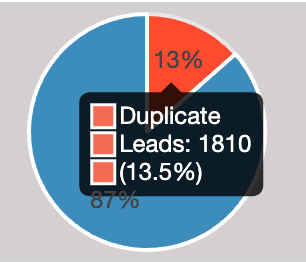
To check a new parameter via the chart, click the “Add a Chart” button. Select the parameter in the pop-up window and click the “Save” button.
To remove the existing chart, click the “Remove” button. Then confirm the action in the pop-up window.
Lead Parameter Comparison
The Lead Parameter Comparison report displays the distribution of lead parameter values for a selected publisher compared with the system total or another publisher for a chosen lead parameter, segmented by all leads, sold leads, and rejected leads. For example, if the selected lead parameter is Bank Account Type, the row represents that parameter, while the pie charts show how individual values (such as Checking or Savings) are distributed within each segment. This view helps admins quickly identify abnormal value distributions or inconsistencies between publisher traffic and overall system behavior, supporting lead quality validation and fraud analysis.
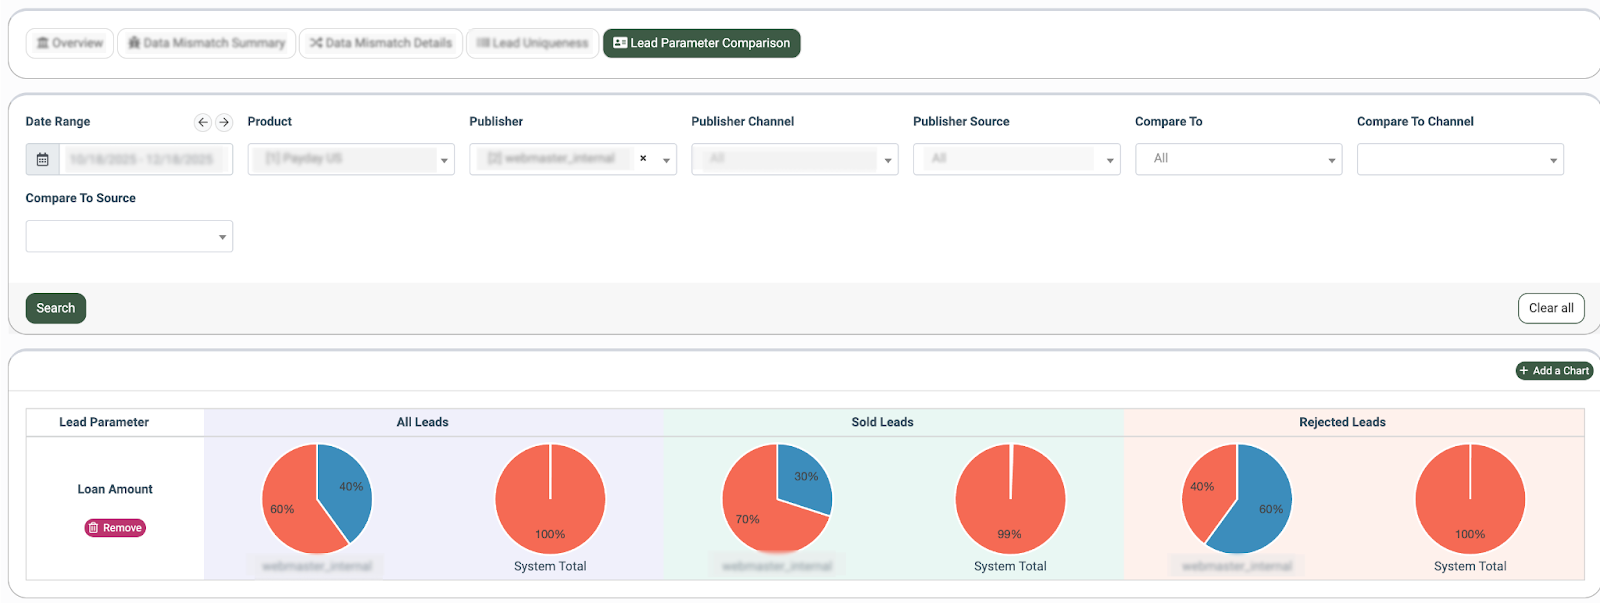
You can narrow down the search results by using the following filters:
- Date Range: Select the date range for the report.
- Product: Select a Product.
- Publisher: Select the Publisher.
- Publisher Channel: Select the Publisher Channel.
- Publisher Source: Select the Publisher Source.
- Compare To: Select a secondary Publisher to compare the data against. Note: If no option is selected in this field, data will be compared to the system total.
- Compare to Channel: Select a secondary Publisher Channel to compare the data against.
- Compare to Source: Select a secondary Publisher Source to compare the data against.
The report contains the following information displayed via charts:
- Lead Parameter: The parameter according to which the comparison is done.
- All Leads: The selected Publisher’s chart for all leads, including the comparison data and system total.
- Sold Leads: The selected Publisher’s sold leads chart, including the comparison data and system total.
- Rejected Leads: The selected Publisher’s rejected leads chart, including the comparison data and system total.
To check a new parameter via the chart, click the “Add a Chart” button. Select the parameter in the pop-up window and click the “Save” button.
To remove the existing chart, click the “Remove” button. Then confirm the action in the pop-up window.