The Per-State Comparison report helps you to analyze statistics of Accept Rate, Posts, Sold, and Total Earnings according to the chosen states.
The Per-State Comparison report displays a comparison between selected states by accept rate, posts, sold leads, and total earnings (sorted by tier, by default).
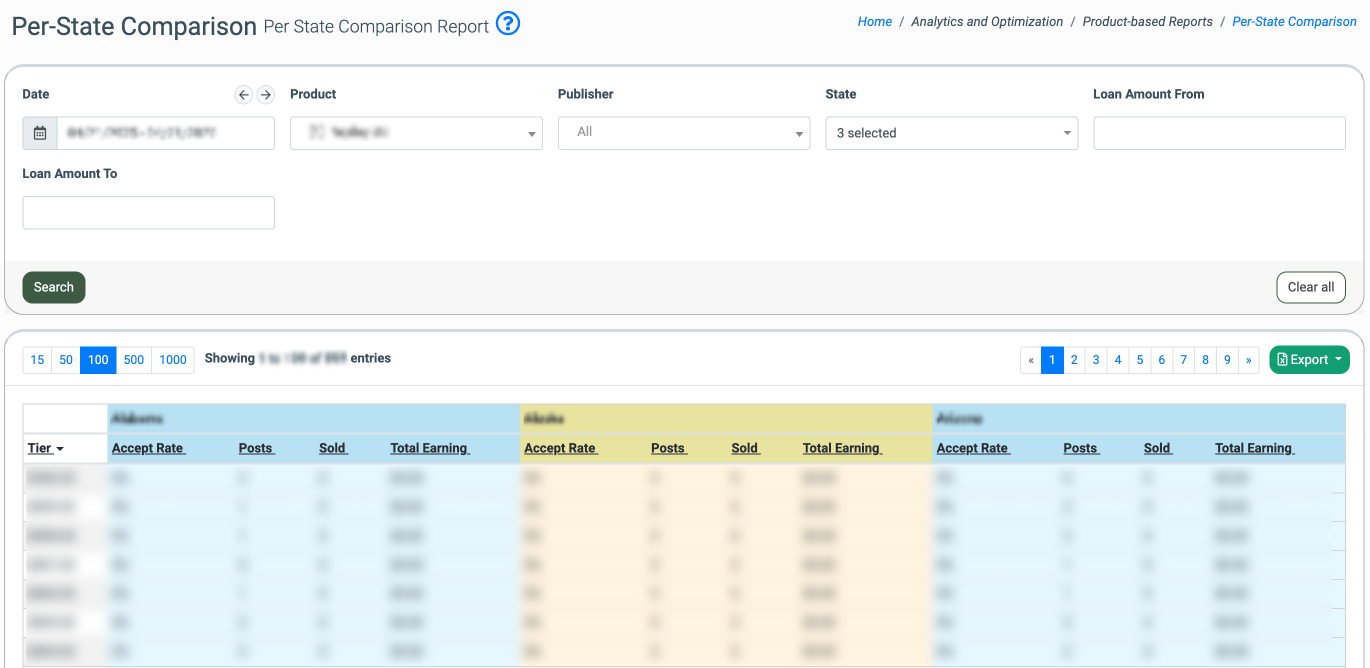
To view the report go to the Analytics and Optimization > Product-based Reports > Per-State Comparison section.
To generate a detail report use the next filter fields:
-
Date - specify the date range;
-
Product - select the product from the drop-down list (required field);
-
Publisher - select the publisher from the drop-down list;
-
States - required field, choose one to pull report by chosen state or more for comparison;
-
Loan Amount From - specify the min loan amount;
-
Loan Amount To - specify the max loan amount (required when Loan Amount From is specified);
The following data is shown in the reports table (for each state):
-
Tier - the tier price (common field for all selected states);
-
Accept Rate - (Post/Sold);
-
Posts - the number of posts;
-
Sold - the number of sold leads;
-
Total Earnings - the total earnings amount.