The Warning Log is a report that gathers warnings from various components, allowing users to identify and resolve issues related to tracking events quickly. For example, if an error occurs during integration or a misconfiguration is detected, users can easily view and address these issues through the report.
To access the report, go to the System Management > Logs > Warning Log section.
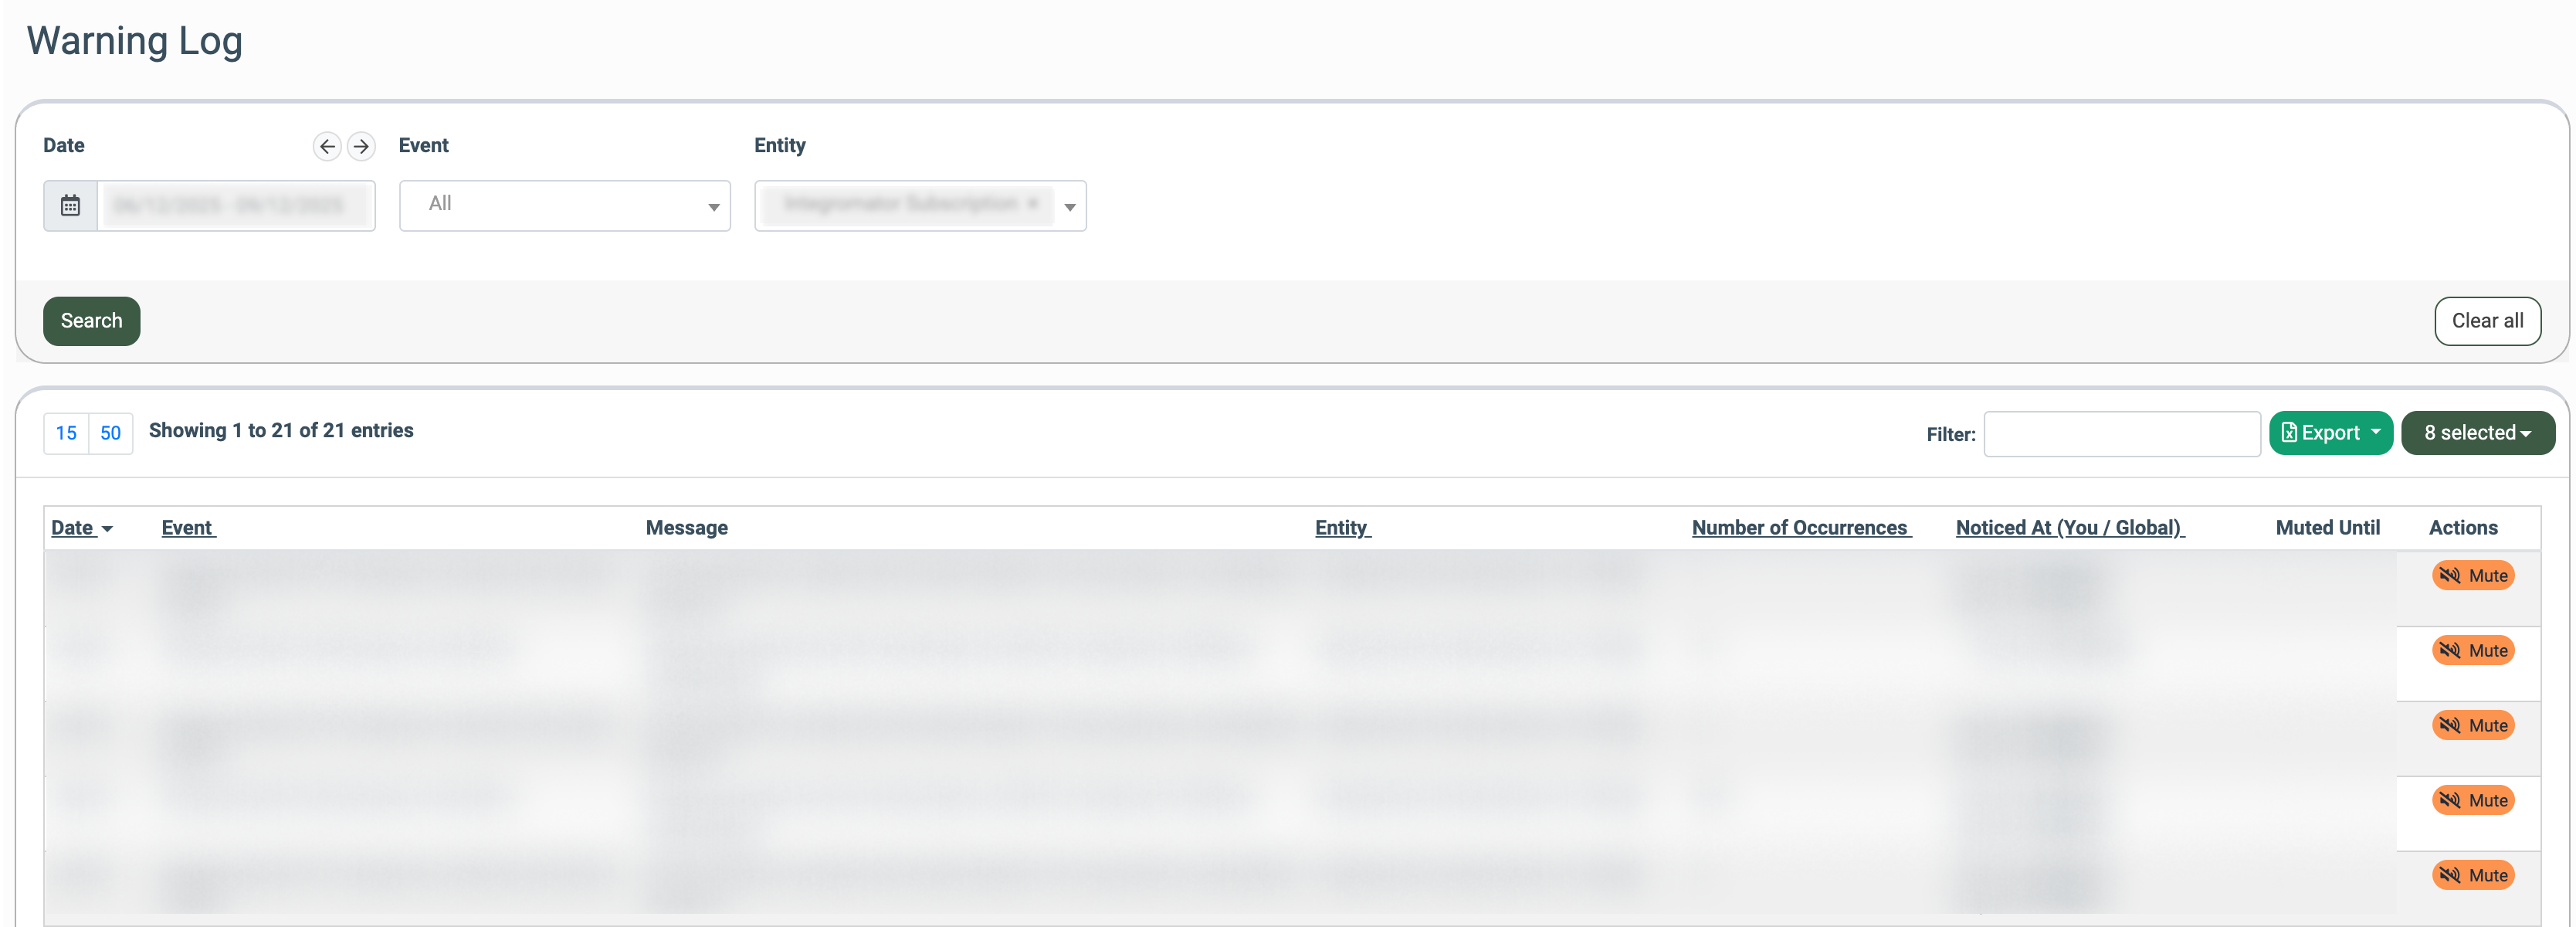
You can narrow down the search results by using the following filters:
- Date: Select the date range for the report.
- Event: Select a specific event that triggered the warning.
- Entity: Select the source of the warning.
The report contains the following information:
- Date: The date and time when the event occurred.
- Event: The event that triggered the warning.
Note: Each service has its own set of events.
- Message: The message that is contained within the warning.
- Entity: The source of the warning.
- Number of Occurrences: The number of times the event occurred.
- Noticed At (You / Global): The first time the warning was seen by the current user/anyone.
- Muted Until: The date and time until which this specific warning is muted.
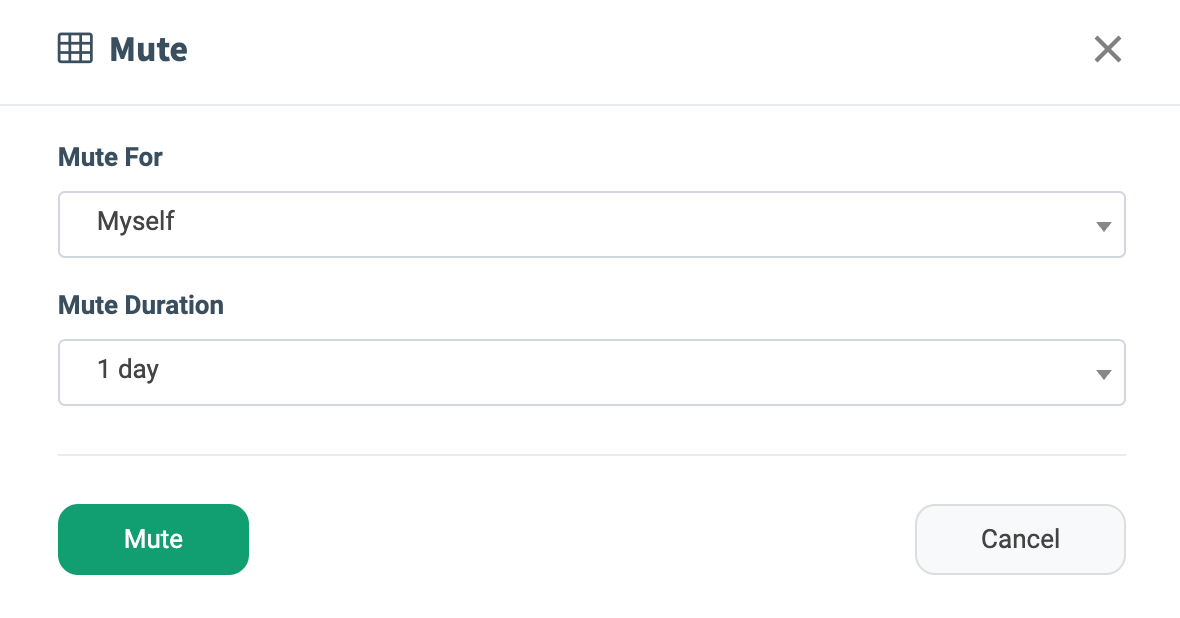
To mute a warning for a specific event and entity, select the record from the list and click the “Mute” button in the “Actions” column. Fill in the following information:
- Mute For: Select whether to mute the warning for the current user or all users.
- Mute Duration: Specify how long you would like the warning to be muted.
Click the “Mute” button to confirm.
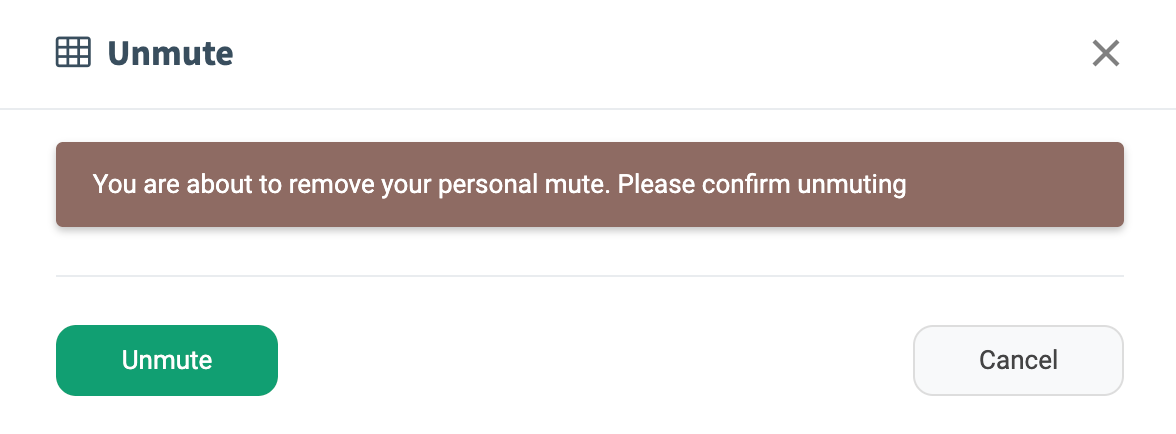
If you need the mute duration to be over, click the “Unmute” button in the “Actions” column. Click the “Unmute” button again to confirm the action.