Note that this section is available only for users with the following system roles: Global admin, Cloud PBX admin, Cloud PBX Department Manager, and Cloud PBX Manager.
To select the department for which you would like to view the summary information, select the option in the “Department” field.
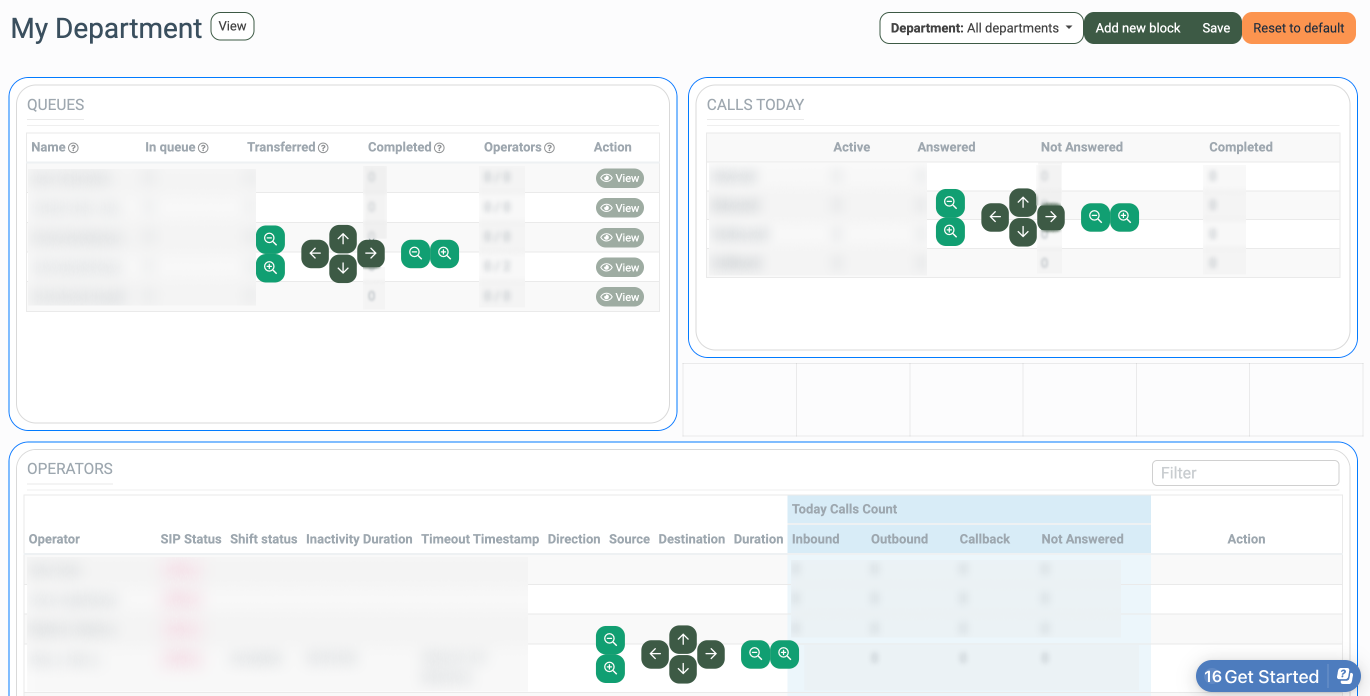
The dashboard contains the three blocks:
The management of the “My Departments” dashboard.
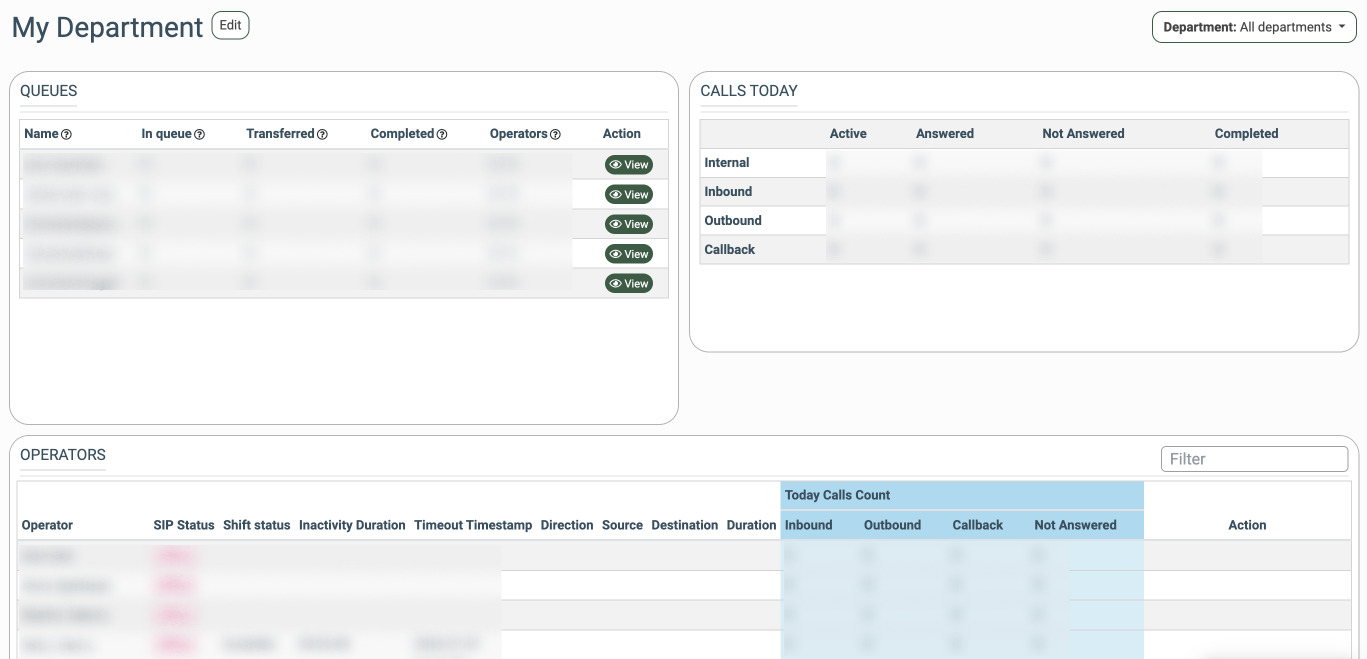
QUEUES
The “Queues” block contains summary details of the queue workflow.
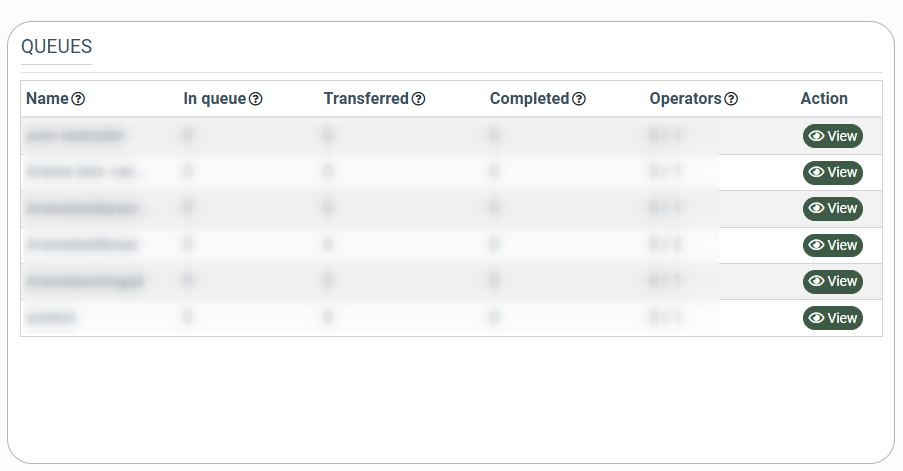
The “Queues” block contains the following information:
- Name: The name of the queue.
- In queue: The number of calls currently in the queue to connect with the operator.
- Transferred: The number of the active calls (the caller is in the conversation with the operator).
- Completed: The number of completed calls via the queue at the current moment.
- Operators: The number of operators attached to the particular queue (total number of operators/the number of operators that are currently online). Note that there will be no operator and queue if they are not assigned to the corresponding department.
To view the detailed information about the calls that are processed via the particular queue, click the “View” button in the “Action” column. You will be redirected to the Call Details report, where the calls are filtered out by the particular queue.
Read more about the Queue section in the following Knowledge Base article.
Read more about the Call Details report in the following Knowledge Base article.
CALLS TODAY
The “Calls Today” block contains summary details about the calls processed for the current date. The information is grouped by the call type according to the destination (Internal, Inbound, Outbound).
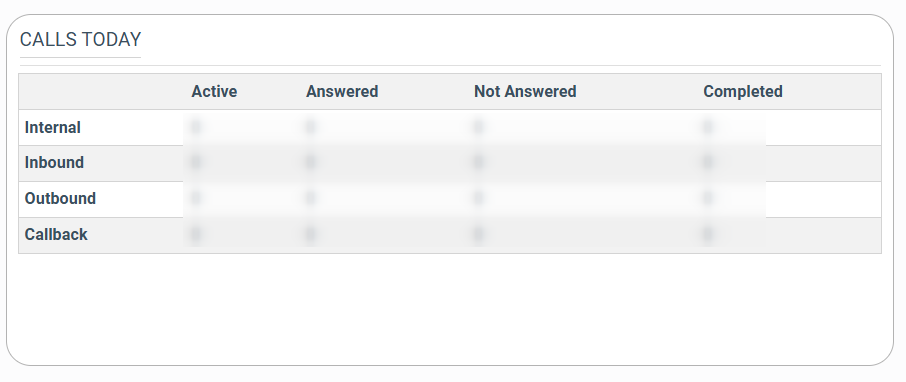
The “Calls Today” block contains the following information:
- Active: The number of calls that are active (the conversation with the operator is in progress) at the current moment.
- Answered: The number of completed calls that are answered and already processed at the current moment.
- Not Answered: The number of completed calls that are not answered by operators at the current moment.
- Completed: The number of calls that are processed and completed via the system at the current moment (the sum of the answered and unanswered calls).
OPERATORS
The “Operators” block contains summary details about the operators' performance.
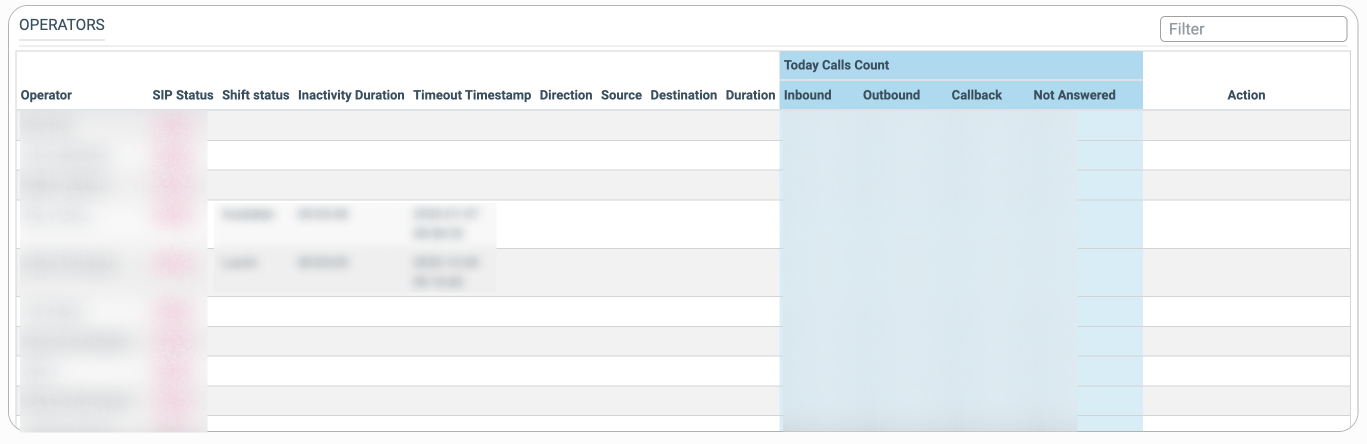
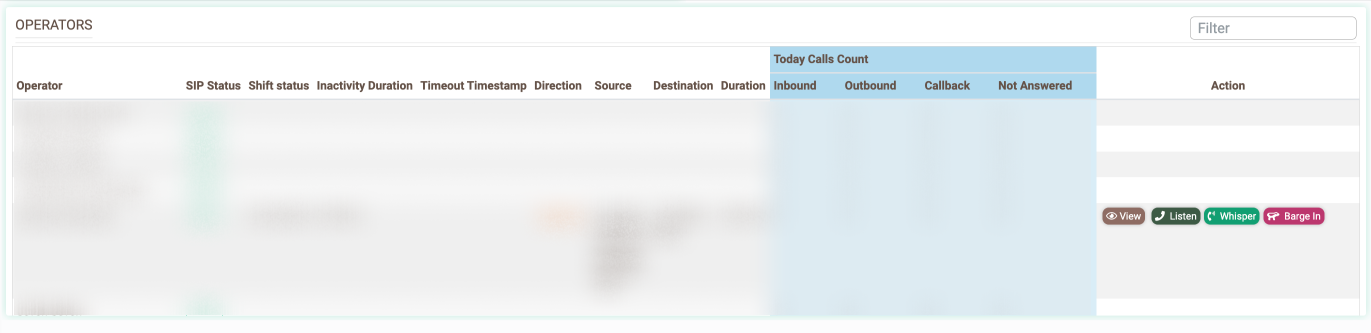
You can narrow down the search results by entering the name of the operator in the “Filter” field.
The “Operators” block contains the following information:
- Operator: The name of the operator.
- SIP Status: The current status of the operator (Online, Offline).
- Shift status: The status of the operator’s shift within which the session was terminated.
- Inactivity Duration: The time duration of the operator’s inactivity.
- Timeout Timestamp: The date and time when the session timeout occurs.
- Direction: The type of call according to the direction (Inbound, Outbound, Internal, Callback).
- Source: The phone number of the caller.
- Destination: The destination phone number for the call.
- Duration: The total duration of the call from the entry to the system up to the current moment.
- Today Calls Count: The block contains the summary information about the number of calls based on the direction:
- Inbound: The current number of inbound calls that were received by the particular operator at the current moment.
- Outbound: The current number of outbound calls that were made by the operator at the current moment.
- Callback: The current number of callbacks that were made by the particular operator at the current moment.
- Not Answered: The current number of missed calls (the calls with the “Not Answered” status) by the operator at the current moment.
Note: The “Shift status”, “Inactivity Duration”, and “Timeout Timestamp” fields are available only if the “Enable Operator Shift Timeout” is enabled on the Project level. Read more information about this setting in the following Knowledge Base article.
The following buttons, located in the “Actions” column, are available for active calls in the “Today Calls Count” block, next to the respective call:
- View: To view the Call Details report sorted by the particular operator, click the “View” button.
- Listen: To join an active call with a notification to the operator and caller about your presence, click the “Listen” button. The following workflow will be applied: the Department Manager clicks the "Listen" button during the active call of the Operator. Then, the Department Manager receives the call alert (his SIP client is ringing on the Manager's side), he accepts this call, and then he will be connected to the ongoing call of the Operator. The operator and the client will hear the ringing sound of the call that is sent to the Manager. This is considered as a notification about the Manager’s presence in the call.
- Whisper: To join an active call with the ability for the operator to hear you, click the “Whisper” button. The caller will not know that you have joined the call.
- Barge In: To join an active call with a notification to the operator and caller with the ability to speak, click the “Barge In” button.
How to configure the “My Department” dashboard
To manage the widgets placed on the “My Department” dashboard, click the “Edit” button.

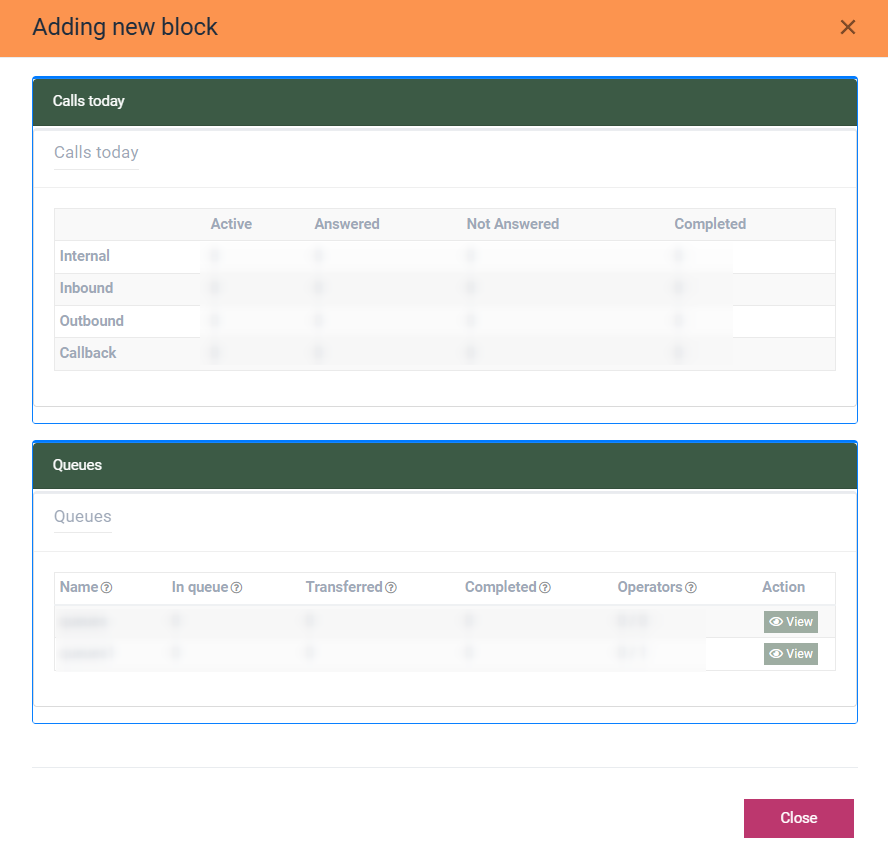
To add a new block to the dashboard, click the “Add new block” button, then select the block that should be added to the dashboard in the “Adding new block” pop-up window.
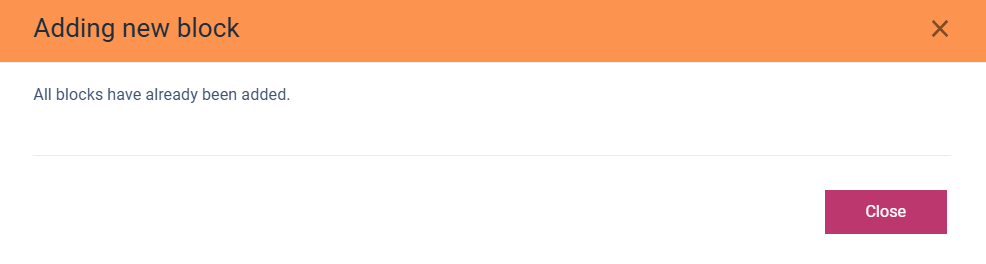
Note that you can add only available blocks. If all available blocks are already added, the following pop-up window will appear:
To manage the height and width of the widget, click the “Decrease/Increase the height” and “Decrease/Increase the width” buttons, respectively.
To move the widget on the dashboard, use the drag-and-drop option or click the corresponding arrow buttons.
To revert the latest change to the dashboard, click the “Undo” button and confirm the action by clicking the “Yes” button in the following pop-up window:
To reset all changes to the dashboard, click the “Reset all changes” button and confirm the action by clicking the “Yes” button in the following pop-up window:
To retrieve the default placement of widgets, click the “Reset to default” button. Click the “Reset” button in the following pop-up window to reset the Dashboard to the system default view:
To save the result of the widget placement management, click the “Save” button.
To exit from the dashboard management section, click the “View” button.