Chartable fields determine which Product fields can be used as dimensions in analytics reports. Once a field is added and enabled in the Product Fields Map, the system begins collecting statistics for that parameter.
After data collection starts, the field becomes available in reports where you can build charts, filter results, and analyze trends based on that parameter.
This mechanism allows you to control which Product parameters are included in analytics and ensures that only relevant data points are used for reporting.
For example, a company distributes leads from multiple traffic sources and wants to monitor potential fraud patterns.
You can add fields such as:
- City
- Active Military
- State
- Loan Amount
After these parameters are added to the Selected Fields list and saved, the system starts collecting data for them.
Later, in reports such as Waves, Lead Uniqueness, or Data Mismatch, you can build charts showing how lead behavior changes depending on these parameters. For instance, you can detect if a specific Publisher generates an unusually high number of duplicate leads or if certain states produce abnormal traffic spikes.
To manage the settings, go to the System Management > Products section, select the Product from the list, click the “Settings” button in the “Actions” column, and select the “Chartable Fields” tab.
Read more about the Products List section in the Knowledge Base article.
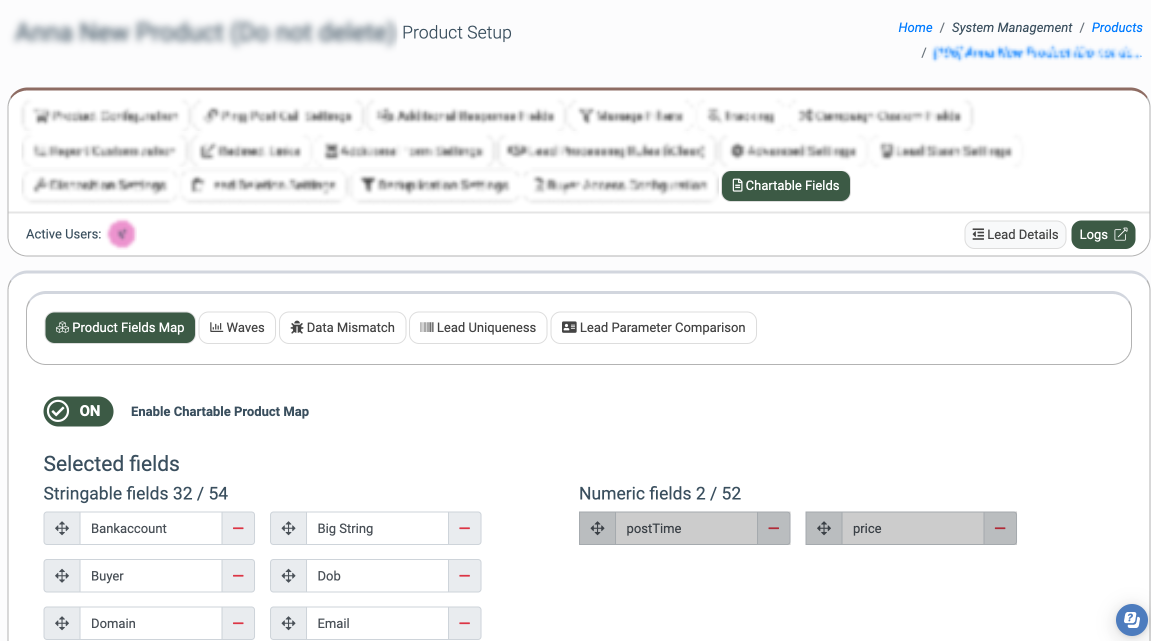
Product Fields Map
The “Product Fields Map” tab allows you to configure the parameters that determine how data is collected for the Data Mismatch Summary, Data Mismatch Details, Lead Uniqueness, Lead Parameter Comparison, and Waves reports.
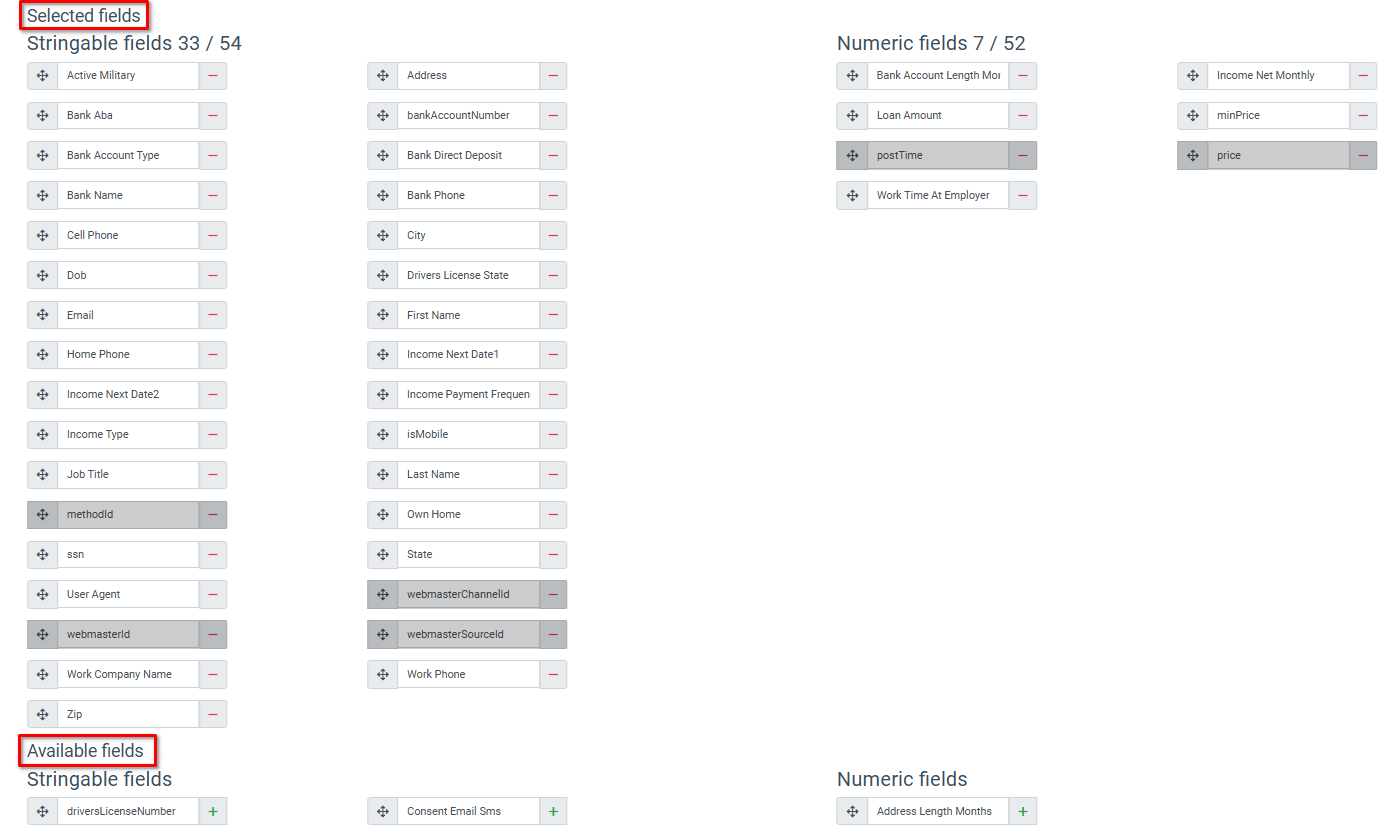
To enable fields mapping, switch the toggle “Enable Chartable Product Map”. There are two field types: string and numeric. To start collecting data for a specific parameter, move the field from the “Available Fields” block to the “Selected Fields” block.
Click the “Save” button below to apply changes.
From that point, the field becomes available for building the list of fields used in charts in the Data Mismatch Summary, Data Mismatch Details, Lead Uniqueness, Lead Parameter Comparison, and Waves reports.
Field editing is available on the next tabs when the “Enable Chartable Product Map” setting is enabled.
Note: You can add all standard Product fields, including the Advanced Fields. If the Product is custom, all fields are also available, including both active and inactive ones.
Reporting
The rest of the tabs provide you with the same number of settings and allow you to configure the fields that will be available for charting in the corresponding reports.
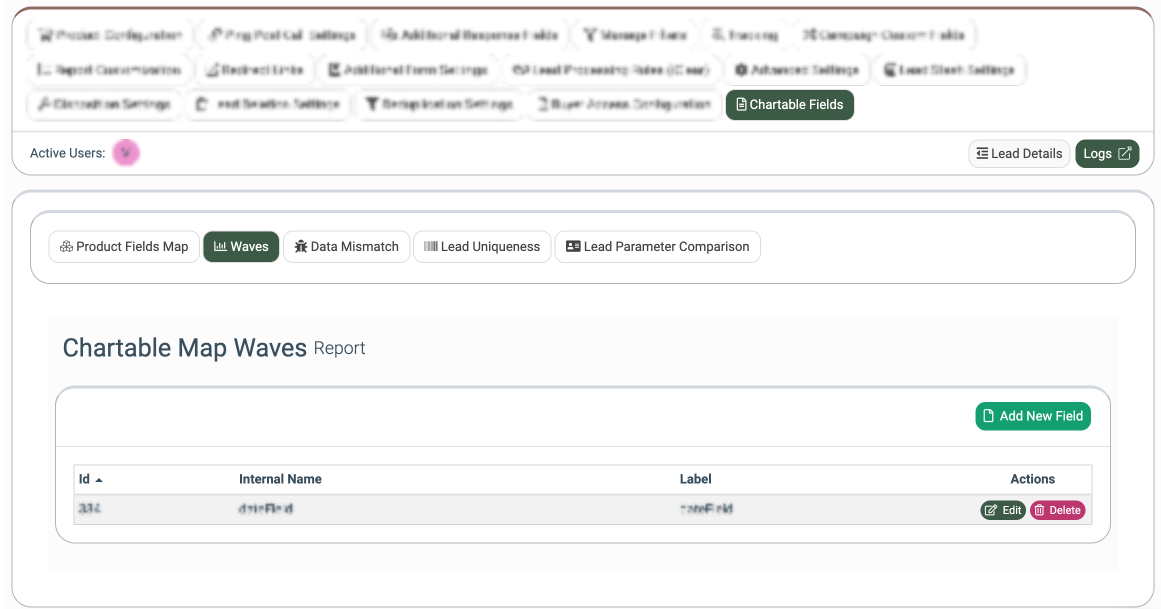
The “Waves” tab allows you to configure the fields that will be available for charting in the Waves report. Read more about the Waves report in the Knowledge Base article.
For the “divisionField” internal name, there are two additional fields:
- Numerator Params: Select the field for the numerator. Click the “Add” button to add another numerator.
- Denominator: Select the field for the denominator.
This field allows you to implement more complex logic using the division of numeric fields:
- Numerator Params: The fields are subtracted from each other (if several parameters are added).
- Denominator: The field by which the division will be made (when divided by 0, division by 1 occurs).
Note: The divisionField is available only for the “Waves” report.

Click the “Add” button to finish.
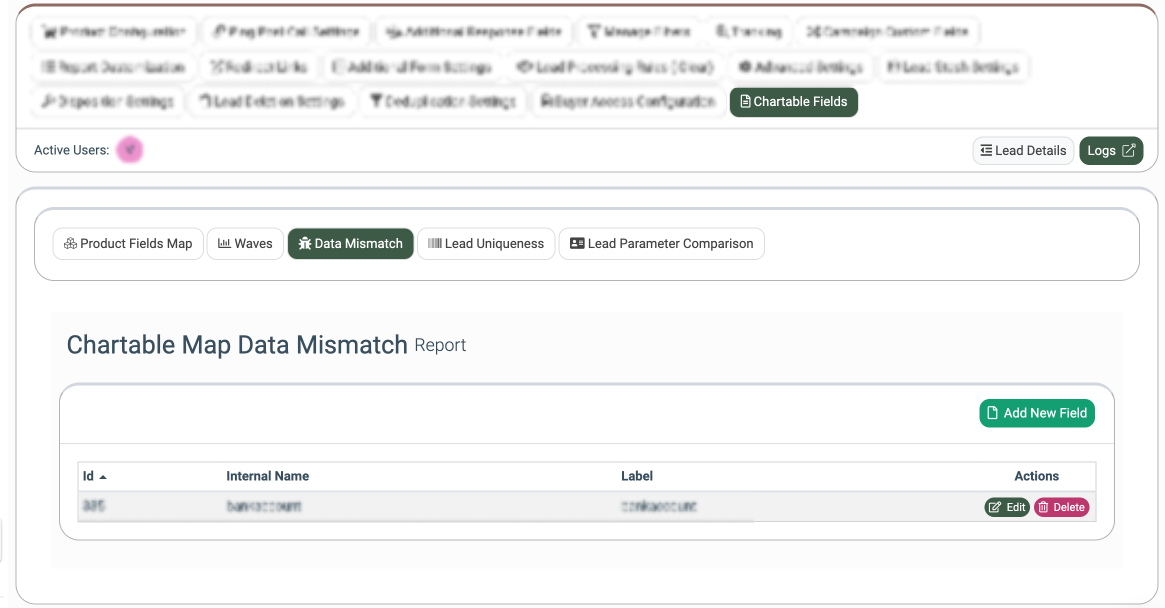
The “Data Mismatch” tab allows you to configure the fields that will be available for charting in the Fraud and Anomaly > Data Insights > Data Mismatch Summary and Data Mismatch Details reports. Read more in the Knowledge Base article.
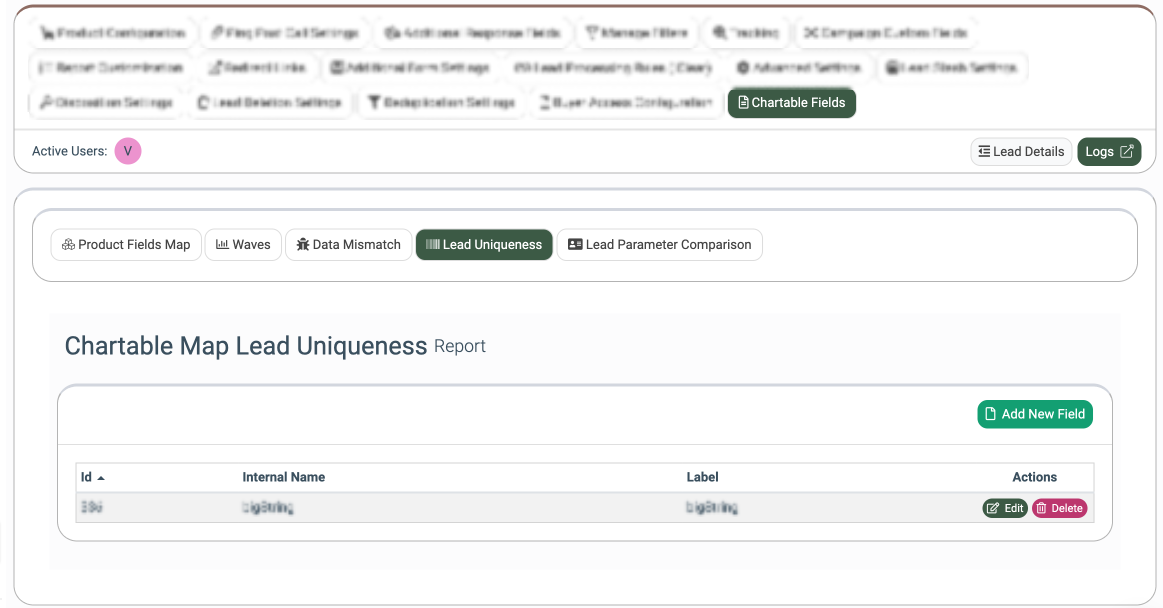
The “Lead Uniqueness” tab allows you to configure the fields that will be available for charting in the Fraud and Anomaly > Data Insights > Lead Uniqueness report. Read more about the Lead Uniqueness Report in the Knowledge Base article.
The “Lead Parameter Comparison” tab allows you to configure the fields that will be available for charting in the Fraud and Anomaly > Data Insights > Lead Parameter Comparison report. Read more in the Knowledge Base article.
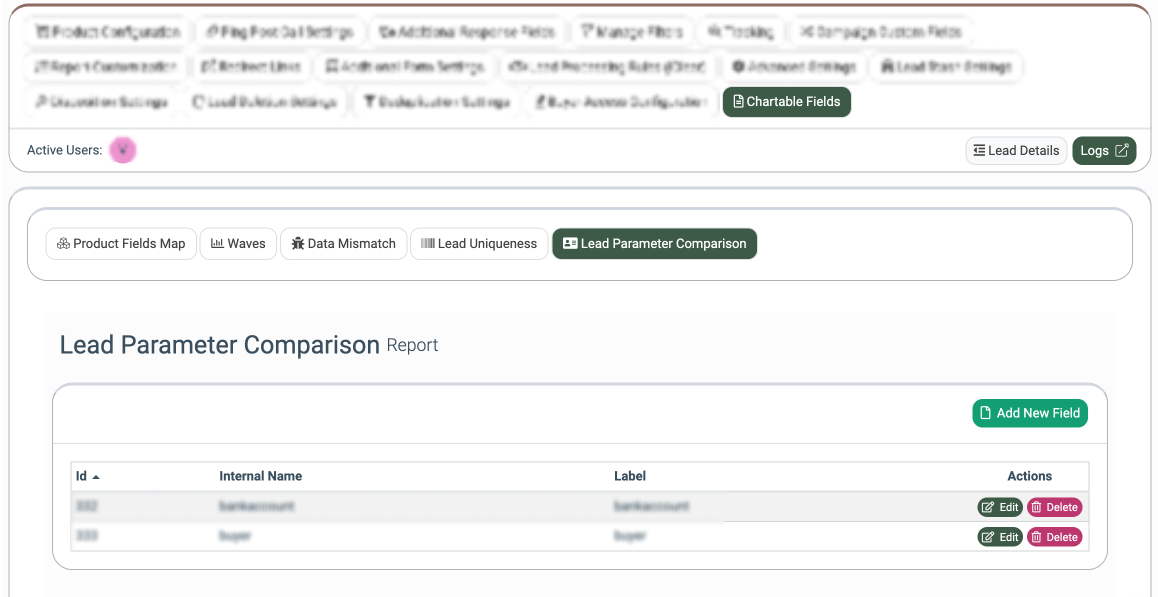
These tabs contain the following information:
- Id: The identification number of the field.
- Internal Name: The internal name of the field.
- Label: The label of the field.
To add a new field, click the “Add New Field” button and fill in the required fields:
- Internal Name: Select the internal name of the field.
- Label: Enter the label of the field.
