To view the “Delivery summary” report, go to All Reports > Mailing Reports > Delivery Summary.
The section contains four tabs:
-
Group by Hour.
-
Group by Date.
-
Group by Month.
-
Group by Year.
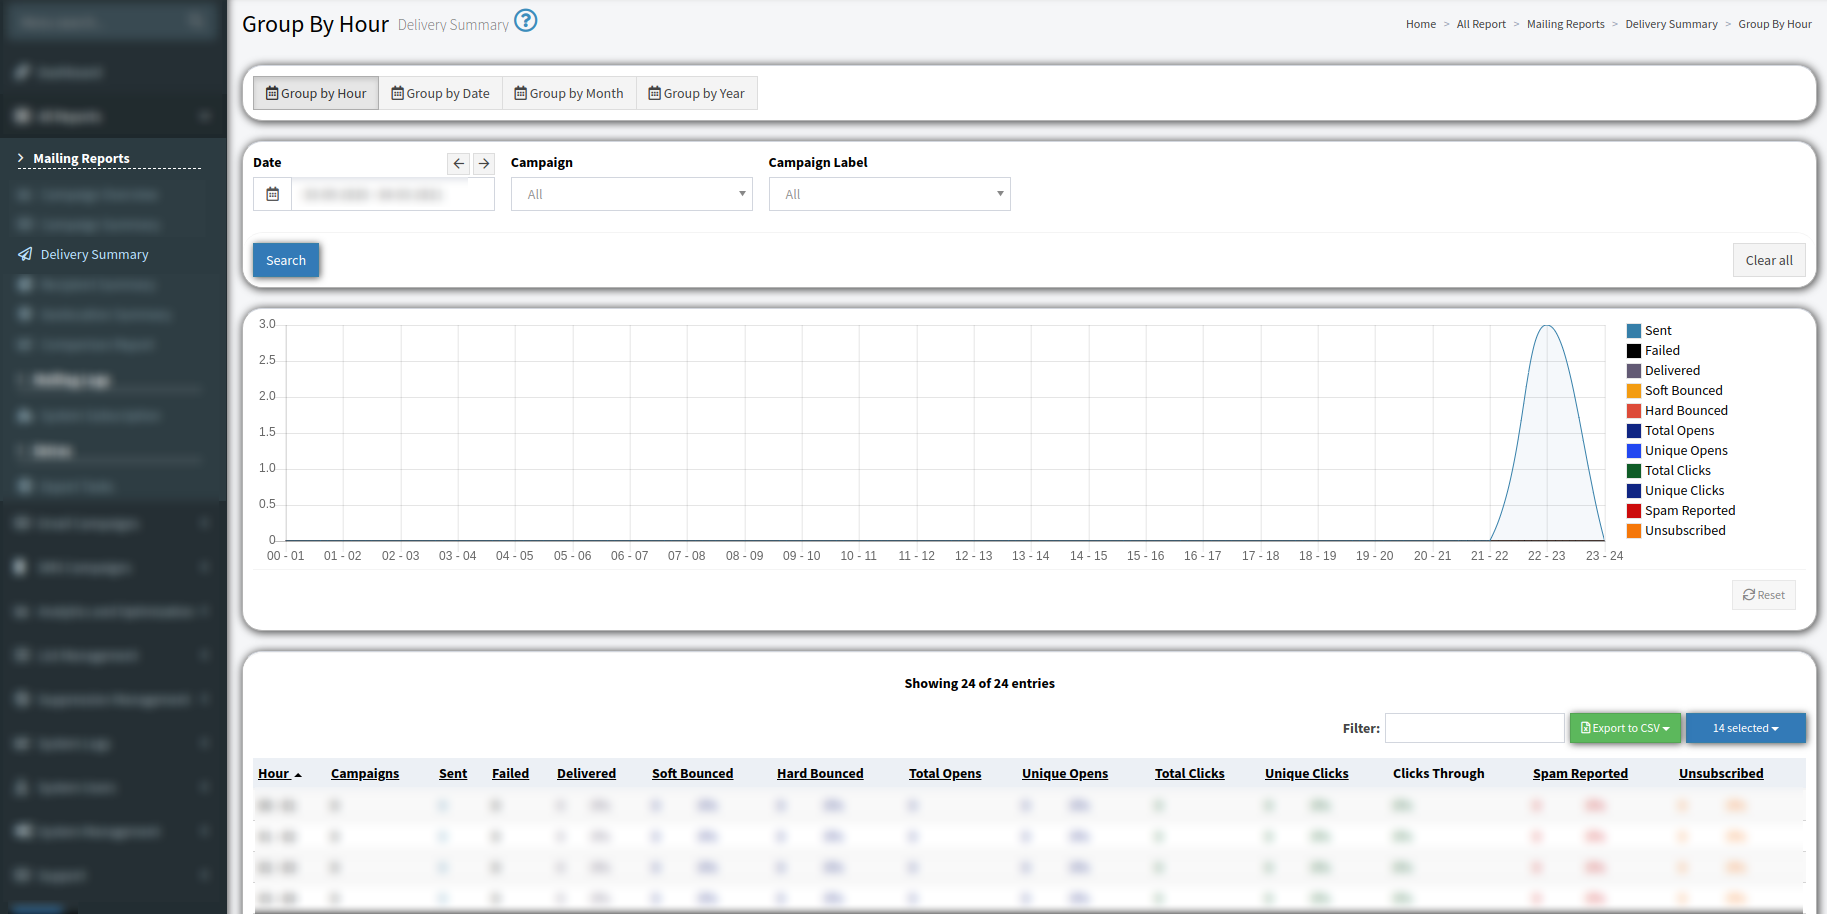
In the “Group by Hour” tab, you can view the hourly summary breakdown.
The block with the graph contains the following information:
-
Sent: The total number of sent emails.
-
Failed: The number of failed to send emails.
-
Delivered, %: The number of delivered emails and a percentage of sent and delivered values.
-
Soft Bounced, %: The total number of not delivered emails from all Campaigns due to email service issues and their percentage in the total number of sent emails.
-
Hard Bounced, %: The total number of not delivered emails from all Campaigns due to email address issues and their percentage of the total number of sent emails.
-
Total Opens: The total number of opened emails of all Campaigns.
-
-
Unique Opens, %: The total number of unique opens and the open rate.
-
Total Clicks: The total number of email link clicks.
-
Unique Clicks, %: The number of unique email link clicks and click-to-open rate (the percentage of the unique clicks and unique opens).
-
Spam Reported, %: The total number of emails that users marked as “Spam” and spam rate.
-
Unsubscribed, %: The total number of unsubscribed emails and unsubscribe rate.
The block with the report contains the following information:
-
Hour: The hour intervals.
-
Campaigns: The number of Campaigns.
-
Sent: The total number of sent emails.
-
Failed: The number of failed to send emails.
-
Delivered, %: The number of delivered emails and a percentage of sent and delivered values.
-
Soft Bounced, %: The total number of not delivered emails from all Campaigns due to email service issues and their percentage in the total number of sent emails.
-
Hard Bounced, %: The total number of not delivered emails from all Campaigns due to email address issues and their percentage of the total number of sent emails.
-
Total Opens: The total number of opened emails of all Campaigns.
-
Unique Opens, %: The total number of unique opens and the open rate.
-
Total Clicks: The total number of email link clicks.
-
Unique Clicks, %: The number of unique email link clicks and click-to-open rate (the percentage of the unique clicks and unique opens).
-
Clicks Through, %: The percentage of the unique clicks and the total number of the delivered emails.
-
Spam Reported, %: The total number of emails that users marked as “Spam” and spam rate.
-
Unsubscribed, %: The total number of unsubscribed emails and unsubscribe rate.
You can narrow down the search results by using the following filters:
-
Date: Select the date range for the report.
-
Campaign: Select the Campaign.
-
Campaign Label: Select the Campaign label.
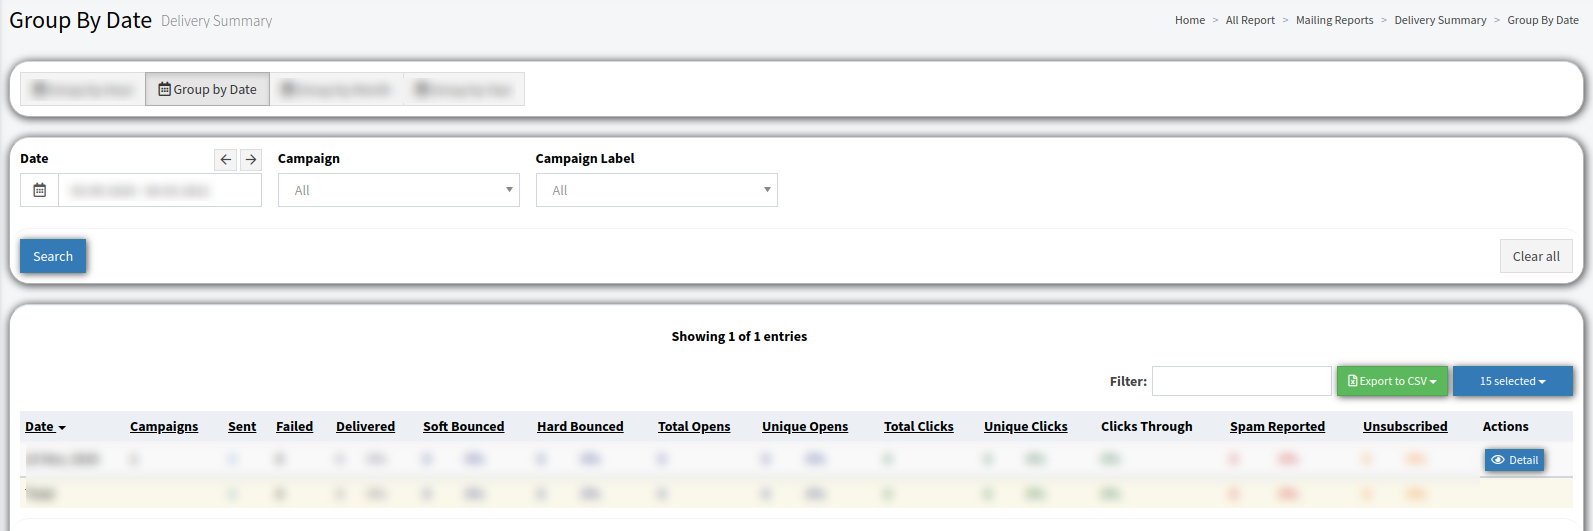
In the “Group by Date” tab, you can view the daily summary breakdown. You can narrow down the search results by using the following filters:
-
Date: Select the date range for the report.
-
Campaign: Select the Campaign from the existing one.
-
Campaign Label: Select the Campaign label from the existing one.
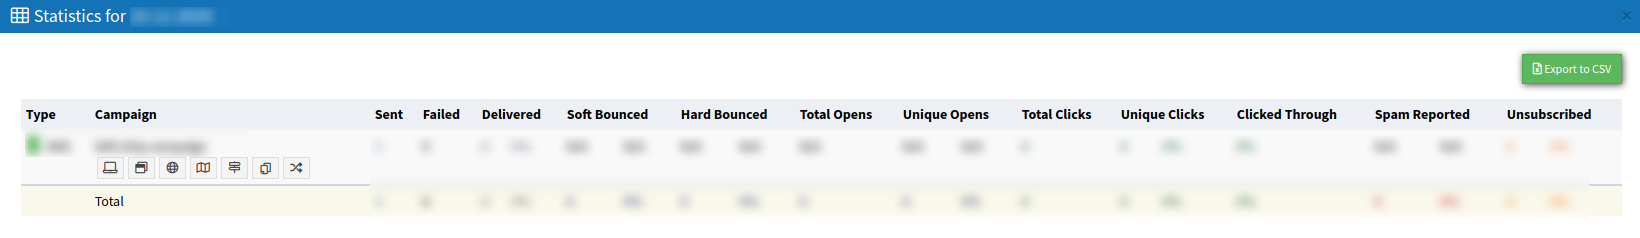
To view the detailed information for a certain date, click the “Detail” button in the “Actions” column. In the “Statistics for MM/DD/YYYY” pop-up window, you will see the detailed breakdown for that date. In the “Campaign” column use the following buttons to go to the corresponding reports:
-
Statistics by Platform redirects to the Recipient Summary report > Group by Platform tab.
-
Statistics by Browser redirects to the Recipient Summary report > Group by Browser tab.
-
Statistics by Country redirects to the Geolocation Summary report > Group by Country tab.
-
Statistics by Region redirects to the Geolocation Summary report > Group by Region tab.
-
Statistics by City redirects to the Geolocation Summary report > Group by City tab.
-
Statistics by Template redirects to the Campaign Summary report > Group by Template tab.
-
Statistics by Channel redirects to the Campaign Summary report > Group by Channel tab.
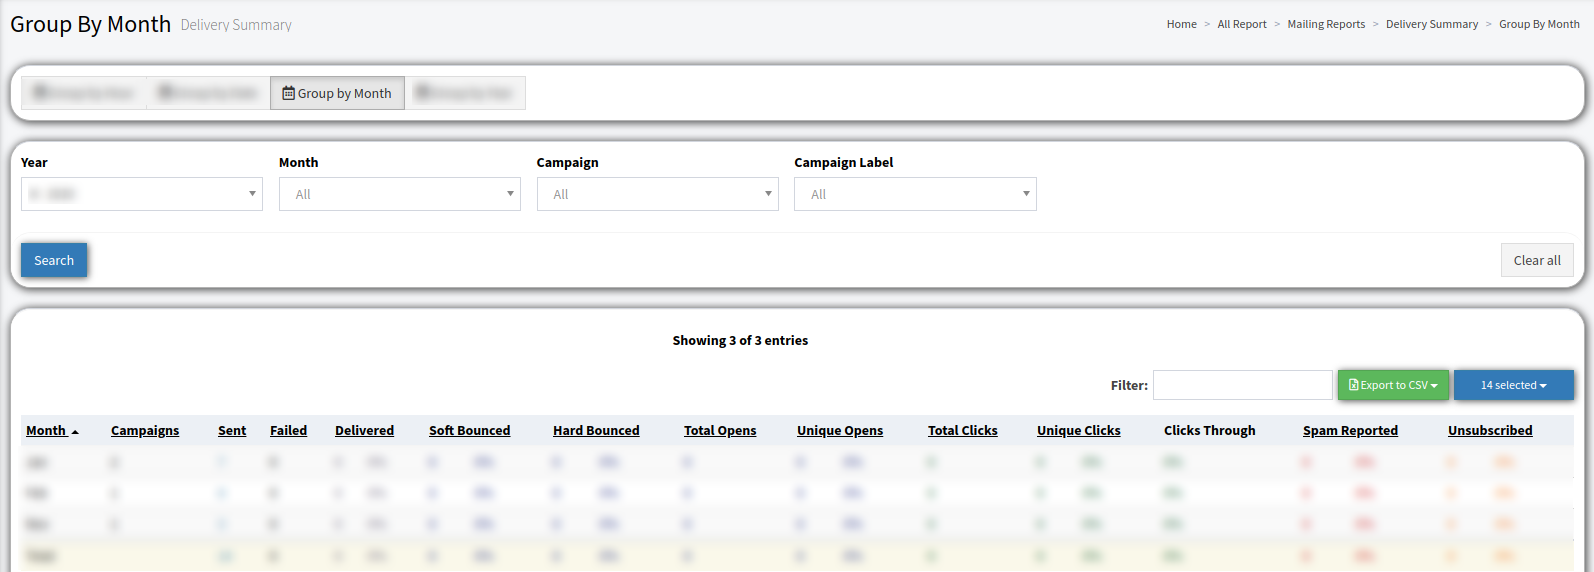
In the “Group by Month” tab, you can view the monthly summary breakdown. You can narrow down the search results by using the following filters:
-
Year: Select the date range for the report.
-
Month: Select the month.
-
Campaign: Select the Campaign.
-
Campaign Label: Select the Campaign label.
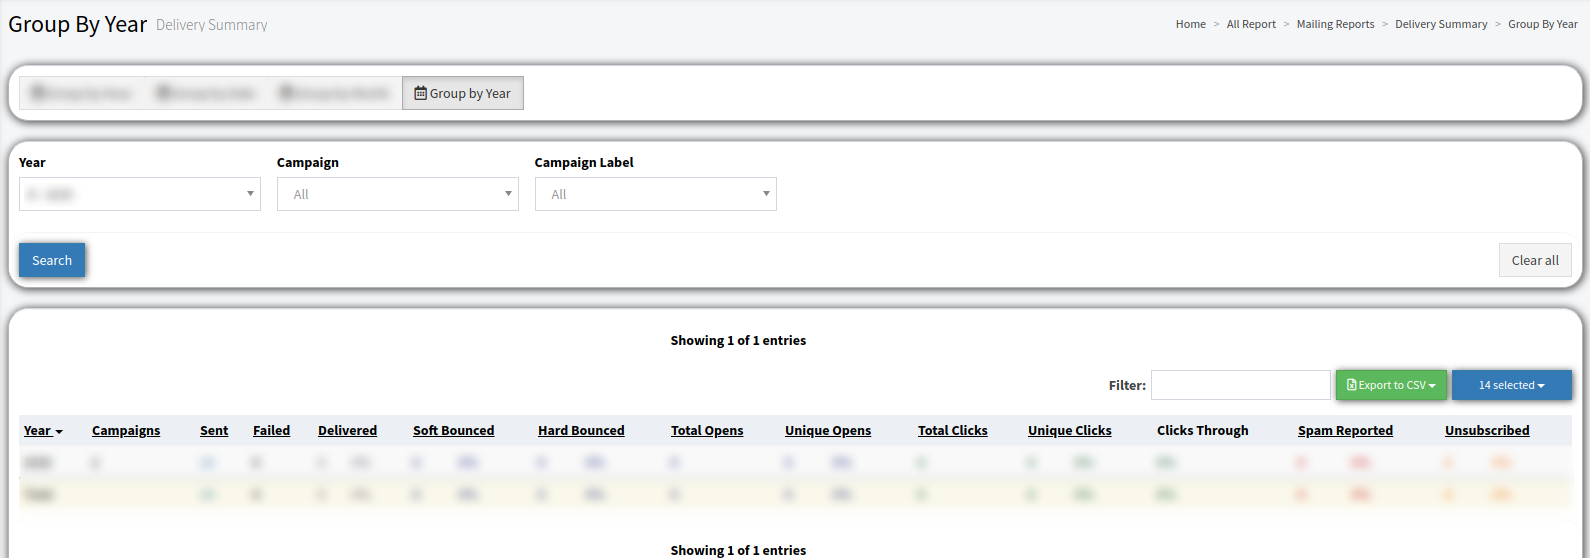
In the “Group by Year” tab, you can see the annual summary breakdown. You can narrow down the search results by using the following filters:
-
Year: Select the date range for the report.
-
Campaign: Select the Campaign.
-
Campaign Label: Select the Campaign label.